Gold Price Forecast: XAU/USD looks to break below $1,840 as US inflation is seen stable above 8%
- Gold price is expected to register a vertical downside move after violating the critical support of $1,840.
- Higher-than-expected US NFP has bolstered gold bears as Fed’s rate hike announcement looks imminent.
- The Fed is highly focused to tame the inflation pressures.
Gold price (XAU/USD) is oscillating in a minor range of $1,840.70-1,842.60 in early Tokyo after an initiative selling structure. The precious metal witnessed a sheer downside move after experiencing a significant selling pressure from Monday’s high near $1,858.00. A pullback move towards $1,858.00 was capitalized by the market participants for initiating fresh shorts on the counter.
The deadly duo of upbeat US Nonfarm Payrolls (NFP) and higher expected US inflation is keeping the luster of the bright metal in check. Last week, the US economy reported the number of generated employment opportunities in May at 390k, significantly higher than the expectations of 325k. While the Unemployment Rate remained stable at 3.6%. A tight labor market in the US and its ability to multiply job opportunities has delighted Federal Reserve (Fed) policymakers. The agency could continue its rate hike announcements with affordable barricades.
The US Bureau of Labor Statistics is expected to report the annual inflation figure at 8.2, a little lower than the former figure of 8.3%. Mounting inflationary pressures are denting the real income of households and expectations of a consecutive jumbo rate hike by the Fed are soaring vigorously.
Gold technical analysis
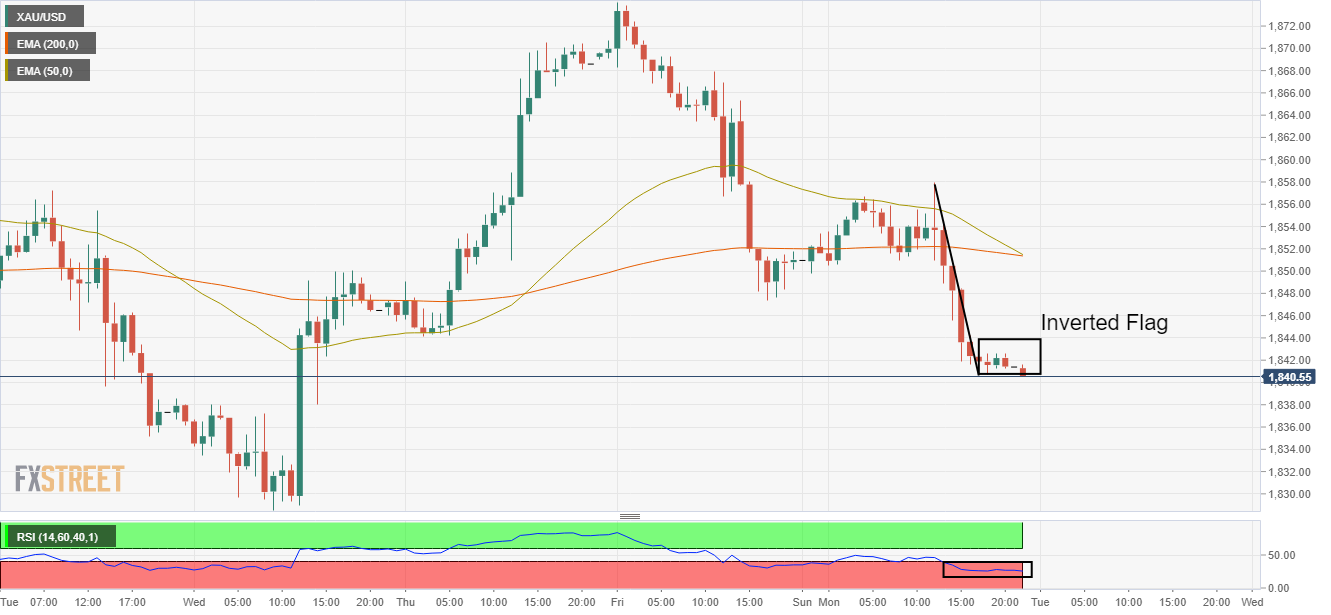
On an hourly scale, Gold spot (XAU/USD) is on the verge of displaying a breakdown of an Inverted Flag, which will keep the gold bears on the driving seat. The 50- and 200-period Exponential Moving Averages (EMAs) are an inch far from displaying a death cross at $1.851.45. Meanwhile, the Relative Strength Index (RSI) (14) is oscillating in a bearish range of 20.00-40.00, which signals a continuation of the downside move by the precious metal further.
Gold hourly chart