AUD/USD Price Analysis: Corrective pullback battles 200-HMA but bears stay hopeful
- AUD/USD picks up bids to refresh intraday high, snaps two-day downtrend.
- 50% Fibonacci retracement, weekly support line restrict short-term downside.
- One-week-old horizontal area, 50-HMA add to the upside filters.
- Higher high on prices, RSI favors bulls to battle short-term resistances.
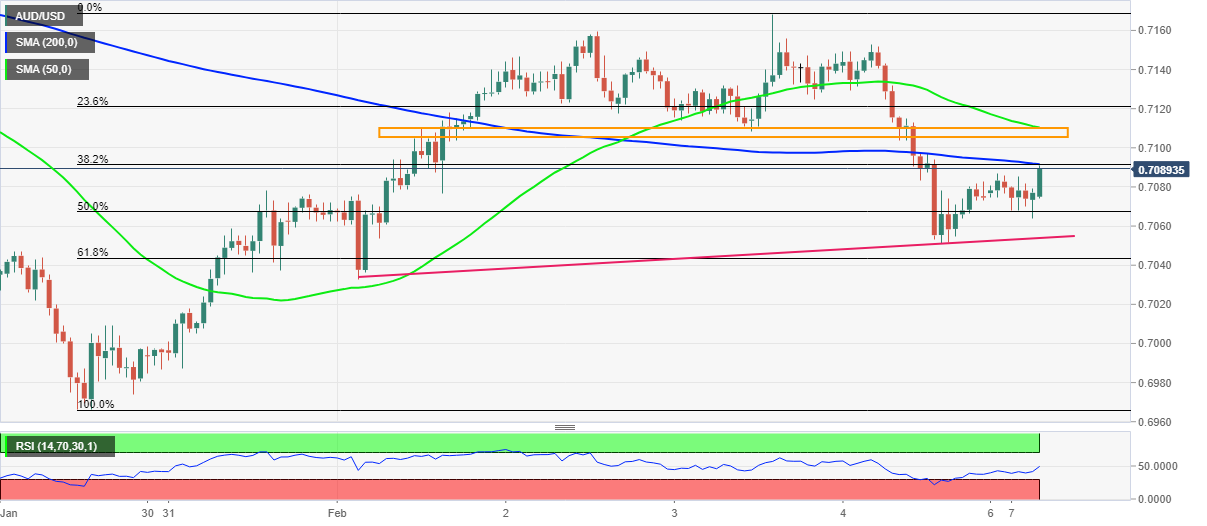
AUD/USD renews intraday high around 0.7090, up 0.20% on a day during early Monday morning in Europe.
In doing so, the Aussie pair portrays a corrective pullback beyond short-term key Fibonacci retracement levels while challenging the 200-HMA. Adding strength to the bullish is the higher low in the RSI line, as well as the AUD/USD prices.
It should be noted, however, that the 200-HMA level of 0.7095 guards the quote’s immediate upside.
Following that, a one-week-old horizontal area joins 50-HMA to challenge AUD/USD bulls around 0.7110, a break of which will confirm short-term bullish bias targeting 0.7170.
Meanwhile, pullback moves may initially test the 50% and 61.8% Fibonacci retracement levels of January 28 to February 03 upside, respectively at 0.7067 and 0.7043.
Also acting as a downside filter is an upward sloping trend line from February 01, near 0.7055.
Should the quote drops below 0.7043, the odds of its further south-run targeting the 0.7000 psychological magnet can’t be ruled out.
AUD/USD: Hourly chart
Trend: Pullback expecte