NZD/USD Price Analysis: Pokes falling wedge resistance on firmer NZ Q3 GDP
- NZD/USD is on the verge of confirming a bullish chart pattern after New Zealand GDP.
- NZ GDP contracted, but below expectations, in Q3.
- MACD turns most bullish in a week, favoring the bulls to aim for the key SMAs.
- Descending trend line from March acts as important support.
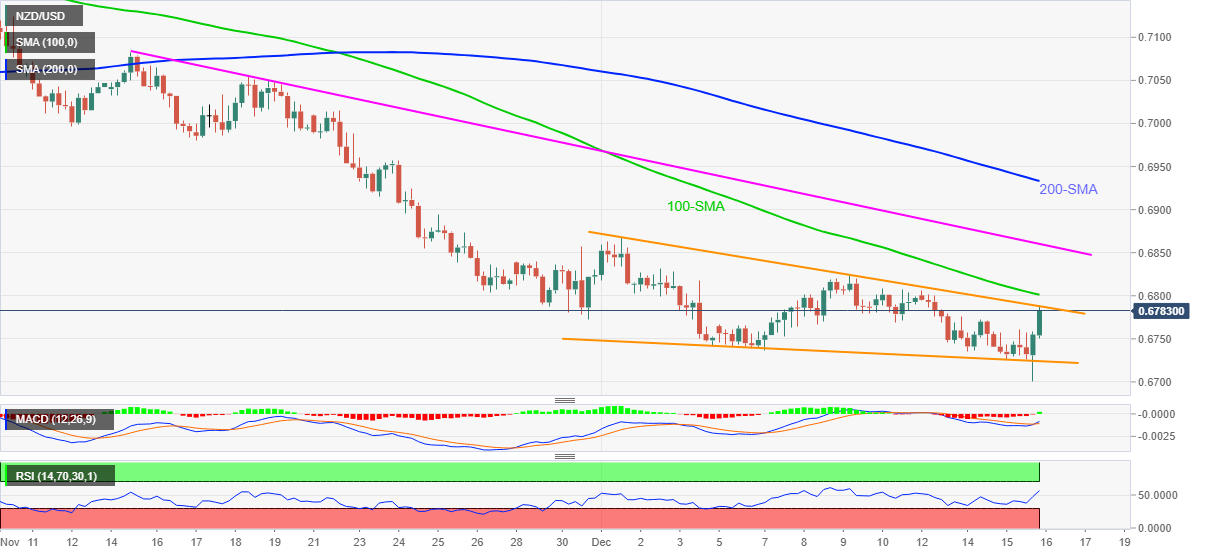
NZD/USD cheers softer-than-expected fall in New Zealand (NZ) Q3 GDP as bulls knock on the door around 0.6780 during early Thursday morning in Asia. In doing so, the kiwi pair is about to confirm a bullish chart pattern named falling wedge, backed by upbeat MACD signals and RSI line.
The 100-SMA level of 0.6800 will act as an additional upside filter, other than the immediate 0.6790 hurdle, before welcoming the NZD/USD buyers. Following that, a run-up towards the 200-SMA level of 0.6933 can’t be ruled out.
It’s worth noting that a month-old descending trend line, around 0.6860, will precede the late November swing high close to 0.6960 to act as additional upside filters.
Meanwhile, pullback moves will be tested by the lower line of the stated wedge formation, near 0.6725, a break of which will recall the 0.6700 threshold on the chart, which also comprises a descending support line from March.
In a case where NZD/USD bears keep the reins past 0.6700, a downward trajectory towards late 2020 bottom near 0.6590 can’t be ruled out.
NZD/USD: Four-hour chart
Trend: Further upside expected