WTI Price Analysis: Bulls attack weekly resistance below $68.00
- WTI refreshes intraday high to consolidate losses marked during the last five weeks.
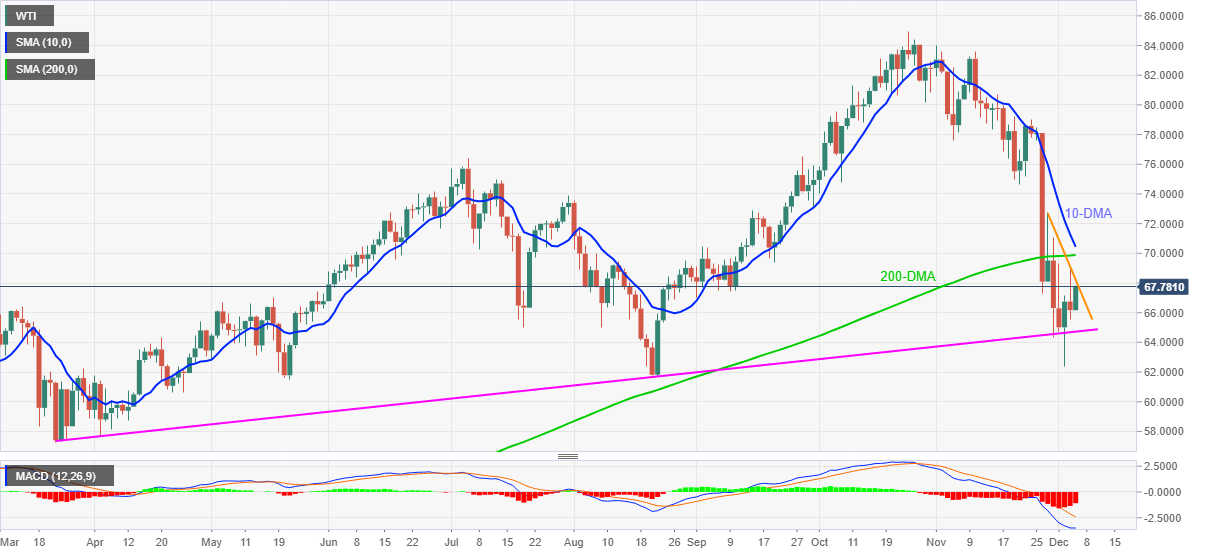
- Bearish MACD also challenges the buyers, 10-DMA, 200-DMA act as additional upside filters.
- Sellers remain away beyond an ascending support line from late March.
WTI takes the bids around $67.80, up 2.45% intraday during Monday’s Asian session. In doing so, the US oil benchmark reverses the previous day’s losses while keeping the bounce off an upward sloping support line from March 23.
However, bearish MACD signals and a weekly descending trend line near $68.25 challenge the energy bulls.
Even if the quote rises past $68.25, the 200-DMA and the 10-DMA, respectively around $69.90 and $70.45, will challenge the WTI buyers.
In a case where the oil prices rally beyond $70.45, the late November’s swing low near $74.65 will be in focus.
Alternatively, the stated support line from March, around $64.70, becomes the key level to watch for WTI bear’s entry.
Following that, the recent trough of $62.34 and August month’s low near $61.80 can probe the downside targeting March’s low near $57.25.
WTI: Daily chart
Trend: Pullback expected