US Dollar Index Price Analysis: DXY bears keep 93.20 on radar
- DXY remains pressured around three-week low after a two-day downtrend.
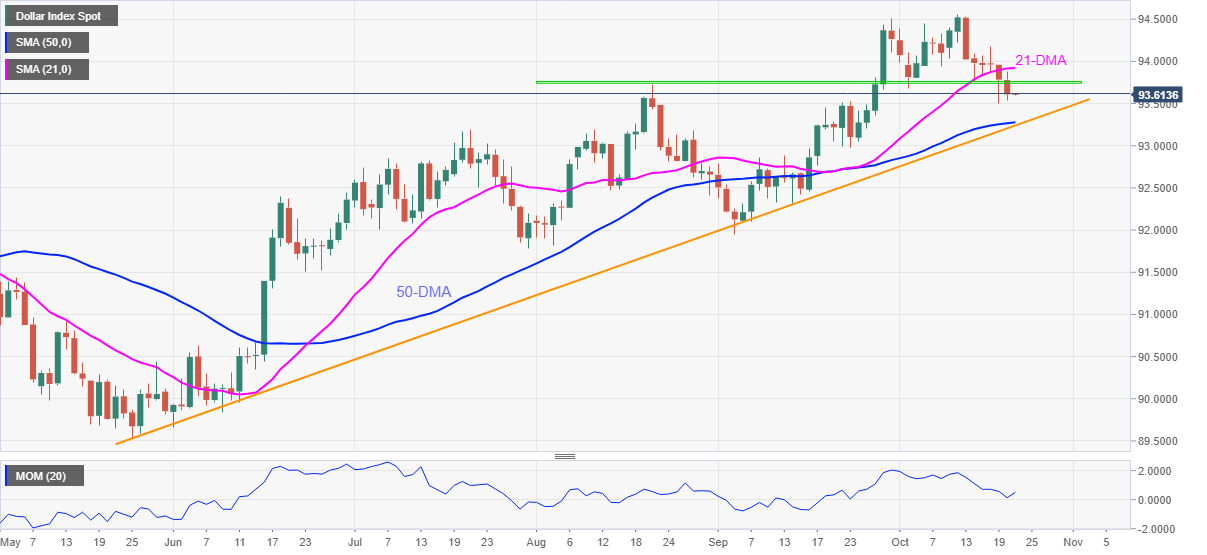
- Clear break of 21-DMA, two-month-old horizontal area favor sellers.
- 50-DMA, five-month-old support line offer a tough nut to crack for the bears.
US Dollar Index (DXY) fades bounce off multi-day low, retreating to 93.60 during Thursday’s Asian session.
The greenback gauge dropped in the last two days following the downside break of 21-DMA and a horizontal area comprising levels marked since August.
Given the firmer Momentum backing the current south-run, US Dollar Index is likely staying on the sellers’ list.
However, a confluence of 50-DMA and an ascending support line from late May, around 93.20, will be a tough nut to crack for the DXY bears.
Should the quote drops below 93.20, September’s low near 91.94 will be in focus.
Alternatively, the stated horizontal area close to 93.75 precedes 21-DMA level near 93.92 to restrict short-term recovery moves of the US Dollar Index.
In a case where DXY bulls manage to conquer 93.92 hurdle, also cross the 94.00 threshold, the yearly top of 94.56 should gain the market’s attention.
DXY: Daily chart
Trend: Further weakness expected