Back
10 May 2021
GBP/USD Price Analysis: Bulls on top in the open, but W-formation is compelling
- GBP/USD bulls are in charge across the charts.
- Cable is printing a bearish W-formation on the daily chart.
GBP/USD is a mixed picture for days ahead as the price extends higher but leaves a bearish chart pattern on the daily time frame.
The following illustrates the bullish bias on the monthly and weekly charts.
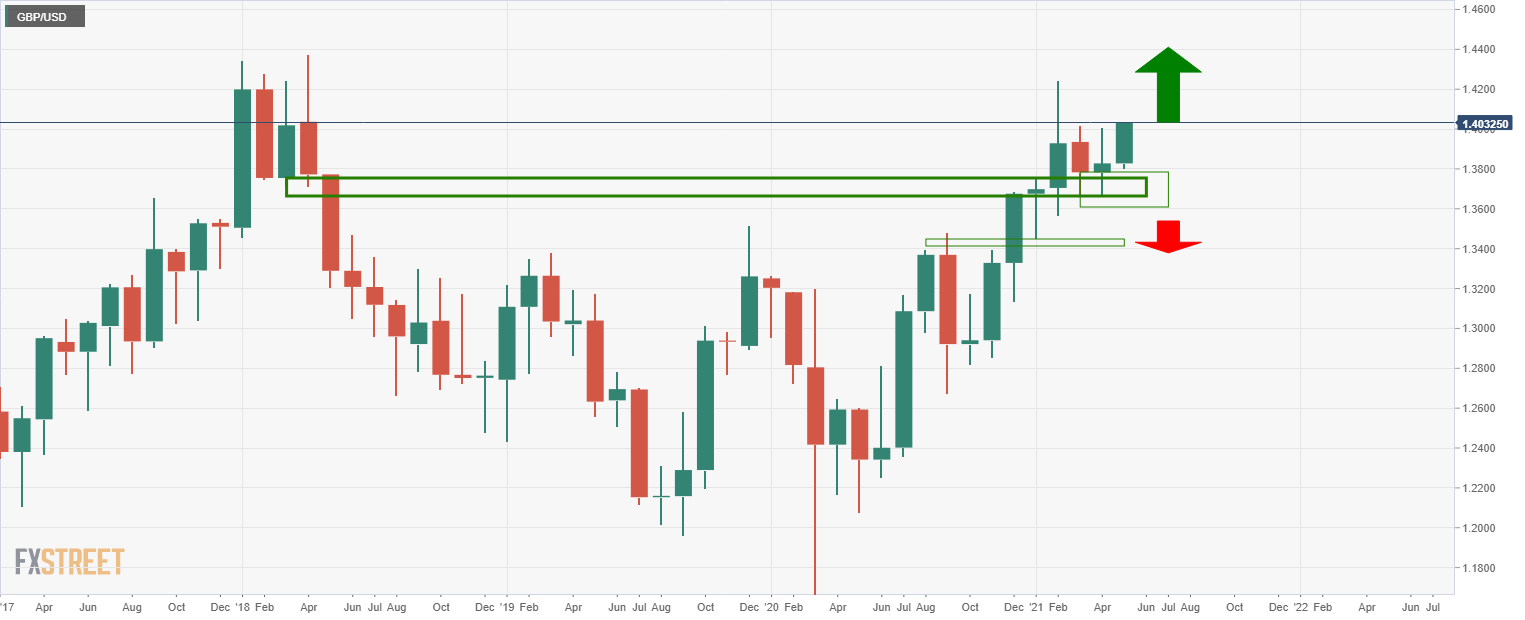
Monthly chart

The monthly chart is bullish while above the support structure as the price runs deeper into the supply territory.
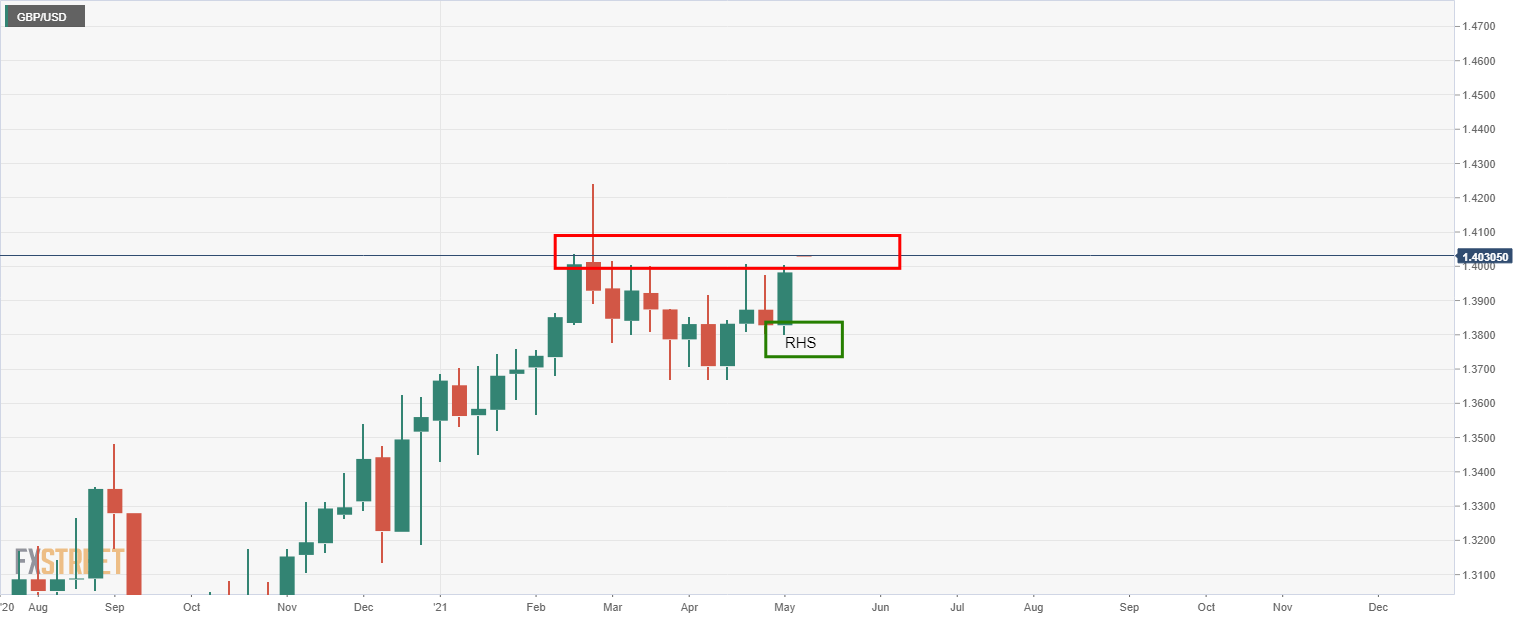
Weekly chart

The weekly chart offers a bullish reverse head and shoulders pattern where the price would be expected to run higher and beyond the weekly resistance.
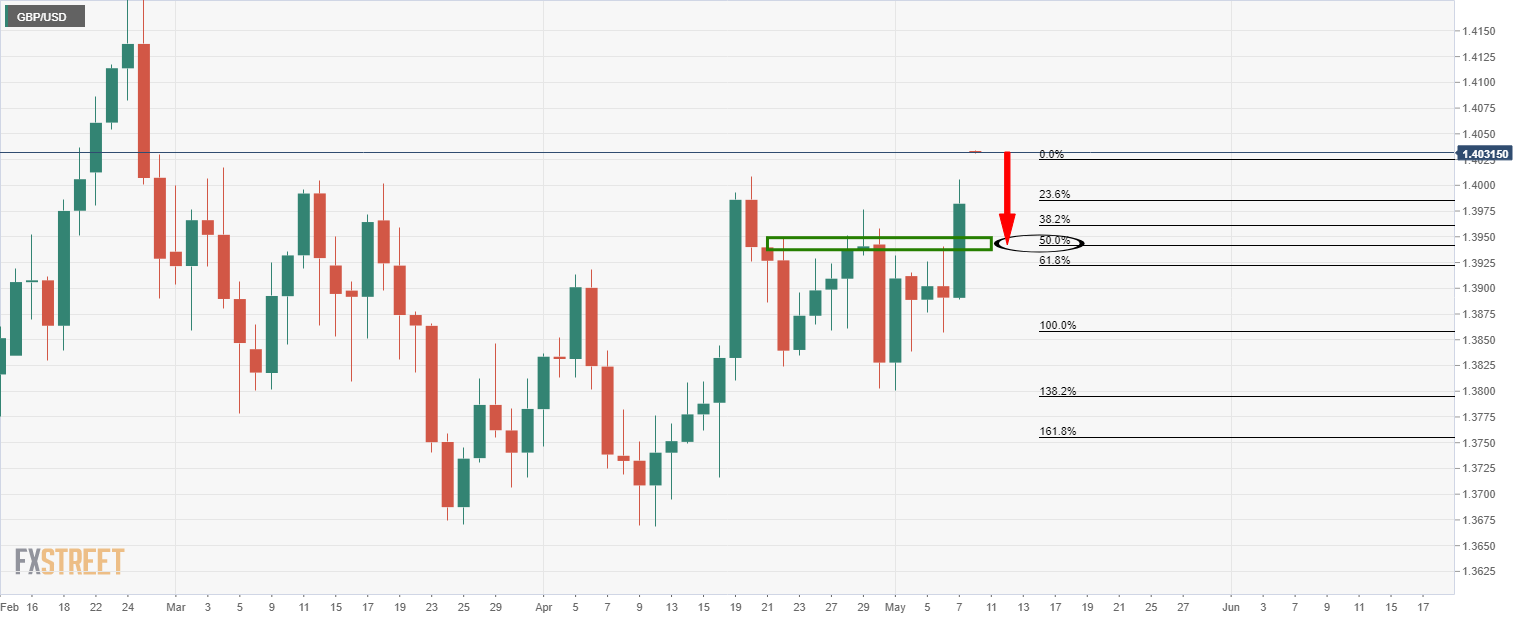
Daily chart

With that being said, there is the scope of a retracement considering the daily W-formation.
The 50% mean reversion aligns with the prior resistance at the neckline of the formation.
Further reading:
GBP/USD flirts with three-week high near 1.4000 as Scottish elections, Brexit test buyers
