USD/JPY Price Analysis: Struggles for direction, stuck in a range just below 109.00
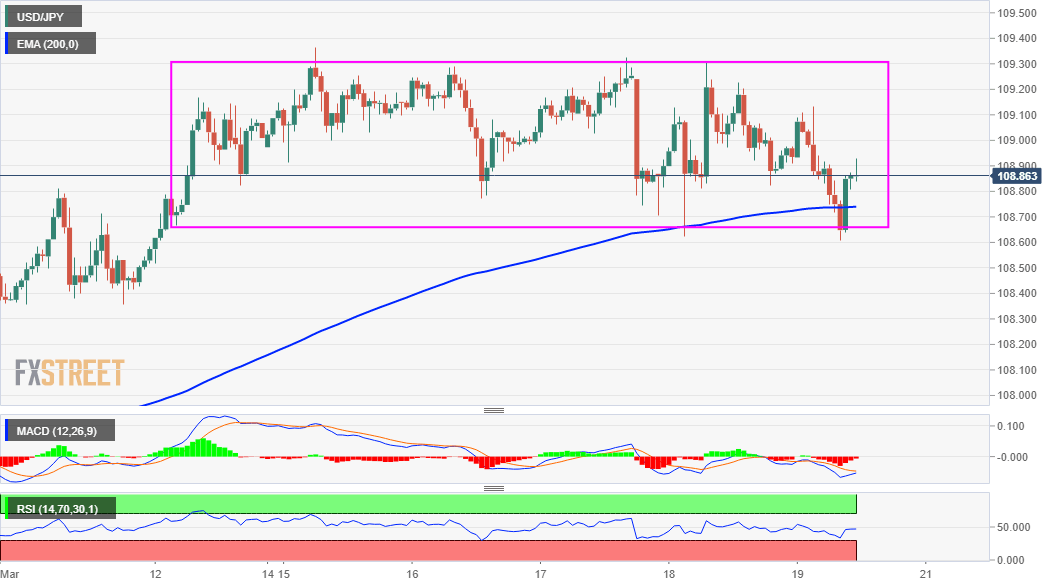
- USD/JPY remains confined in a one-week-old trading range, forming a rectangle.
- The pattern points to a brief pause in the trend before the next leg of a move up.
- Bulls seemed reluctant from placing bets amid overbought RSI on the daily chart.
The USD/JPY pair lacked any firm directional move and seesawed between tepid gains/minor losses through the mid-European session. The pair was last seen trading just below the 109.00 mark, nearly unchanged for the day. The intraday dip showed some resilience below the 200-hour EMA and was quickly bought into near the 108.60 region. This marks the lower boundary of the weekly trading range and should act as a pivotal point for traders.
Looking at a slightly broader picture, the USD/JPY pair has been oscillating in a narrow trading band over the past one week or so. The range-bound price action constitutes the formation of a rectangle on short-term charts. Given the recent strong rally since the beginning of this year, the rectangle marks a brief pause and might still be categorized as a bullish continuation pattern. This, in turn, supports prospects for further near-term gains.
That said, RSI (14) on the daily chart is still holding above the 70.00 mark and points to slightly overbought conditions. This seemed to be the only factor holding investors from placing fresh bullish bets, at least for now. Hence, it will be prudent to wait for a sustained break through the trading range barrier, or multi-month tops around the 109.25-30 region touched earlier this month, before positioning for any further appreciating move.
The USD/JPY pair might then accelerate the momentum and aim to reclaim the key 110.00 psychological mark for the first time since March 2020. The next relevant target on the upside is pegged near the 110.80 region before bulls push the pair further towards the 111.00 round-figure mark.
On the flip side, sustained weakness below the weekly trading range support, around the 108.60 region could be seen as the first sign of bullish exhaustion. Some follow-through weakness below the 108.35-30 region will reaffirm a near-term bearish reversal and prompt some aggressive long-unwinding trade. The subsequent downfall has the potential to drag the USD/JPY pair further below the 108.00 mark en-route the 107.35 intermediate support and the 107.00 level.
USD/JPY 1-hourly chart

Technical levels to watch
