NZD/USD Price Analysis: Stays directed towards yearly support line
- NZD/USD fades bounce off intraday low, prints mild losses on a day.
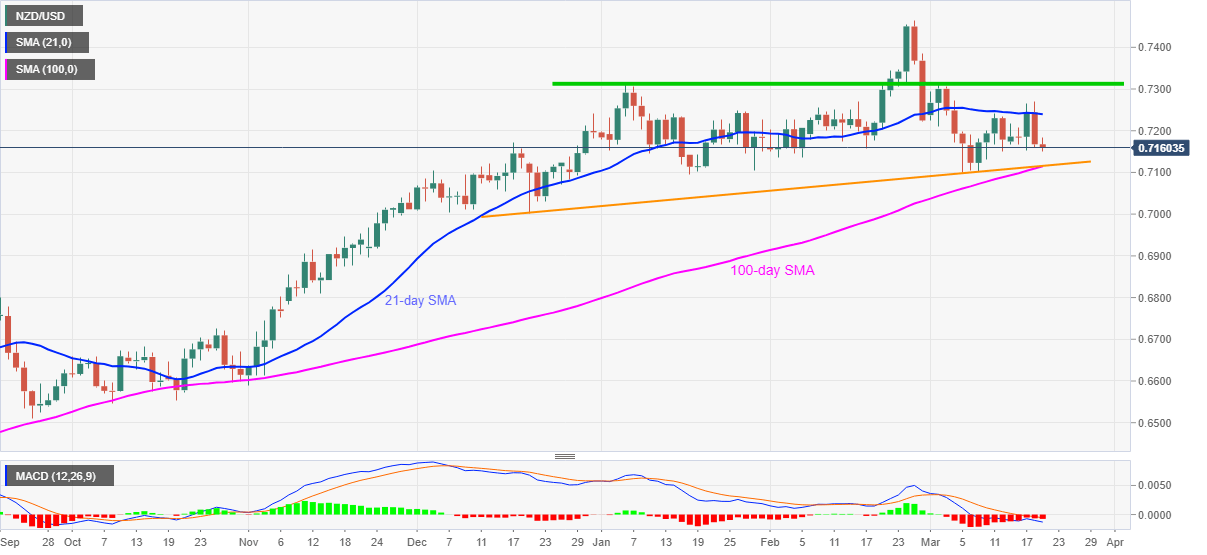
- Sustained trading below 21-day SMA, bearish MACD favor sellers.
- 100-day SMA adds strength to the 0.7115 support confluence.
NZD/USD remains depressed while retreating to 0.7160, down 0.10% on a day, during early Friday. In doing so, the kiwi pair justifies multiple failures to cross 21-day SMA.
Not only repeated pullbacks from short-term SMA but bearish MACD also direct the NZD/USD prices towards a confluence of 100-day SMA and an ascending support line from December 21, 2020.
It should, however, be noted that the quote’s weakness past-0.7115 key level will make it vulnerable to revisit the area surrounding the 0.7000 threshold marked in December 2020.
Alternatively, the corrective pullback may eye the 0.7200 round-figure before attacking the 21-day SMA level of 0.7240.
Also acting as an important upside hurdle is a horizontal region comprising multiple tops marked since January, around 0.7310-15.
Overall, NZD/USD is likely to stay pressured but strong support on the downside challenges the bears.
NZD/USD daily chart
Trend: Further weakness expected