Back
4 Mar 2021
US Dollar Index Price Analysis: Next on the upside comes in 91.60
- DXY keeps pushing higher and target the 91.40 region.
- Bullish attempts face the next hurdle at YTD highs (91.60).
DXY adds to recent gains and once again surpass the 91.00 mark, opening the door to a probable visit to multi-week peaks in the 91.35/40 band (March 2).
A surpass of the latter, ideally in the near-term, carries the potential to spark a move to the yearly peaks around 91.60 (February 5), where the index is expected to meet a tough barrier.
In spite of the strong rebound, the current spike in DXY is deemed as corrective only, as the broader bearish view still weighs on the dollar. If the 91.60 region is surpassed, then the next focus of attention should shift to the Fibo level (of the 2020-2021 drop) at 92.46.
In the longer run, as long as DXY trades below the 200-day SMA (92.96), the negative stance is expected to persist.
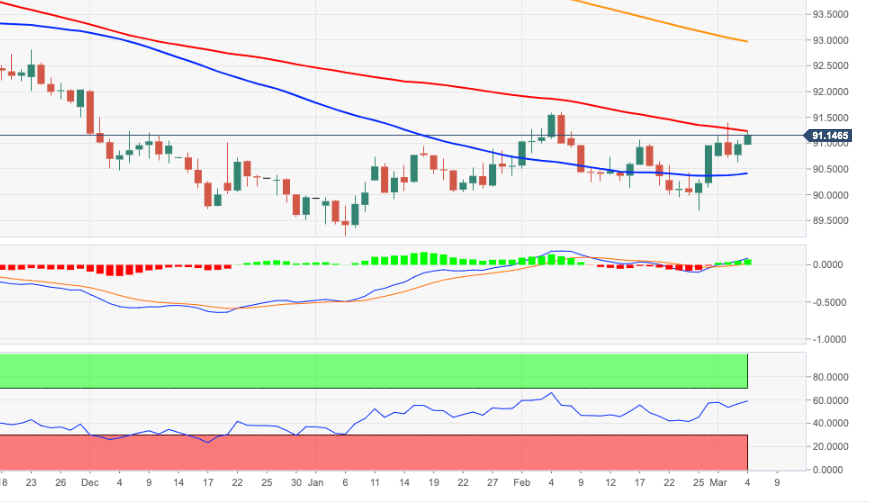
DXY daily chart