Back
3 Feb 2021
EUR/GBP Price Analysis: 4H shows a falling wedge pattern
EUR/GBP's decline from December highs above 0.92 to the recent low of 0.8796 has taken the shape of a falling wedge pattern comprising trendlines connecting lower highs and lower lows. The trendlines, however, are converging in nature and represents a steady weakening of bearish momentum.
As such, a potential breakout would imply a bearish-to-bullish trend change. At press time, the upper end of the falling wedge is seen at 0.8832. A close higher would confirm a breakout and expose resistance at 0.8884 (lower high created on Jan. 28).
The pair is currently trading mostly unchanged on the day near 0.8810.
4-hour chart
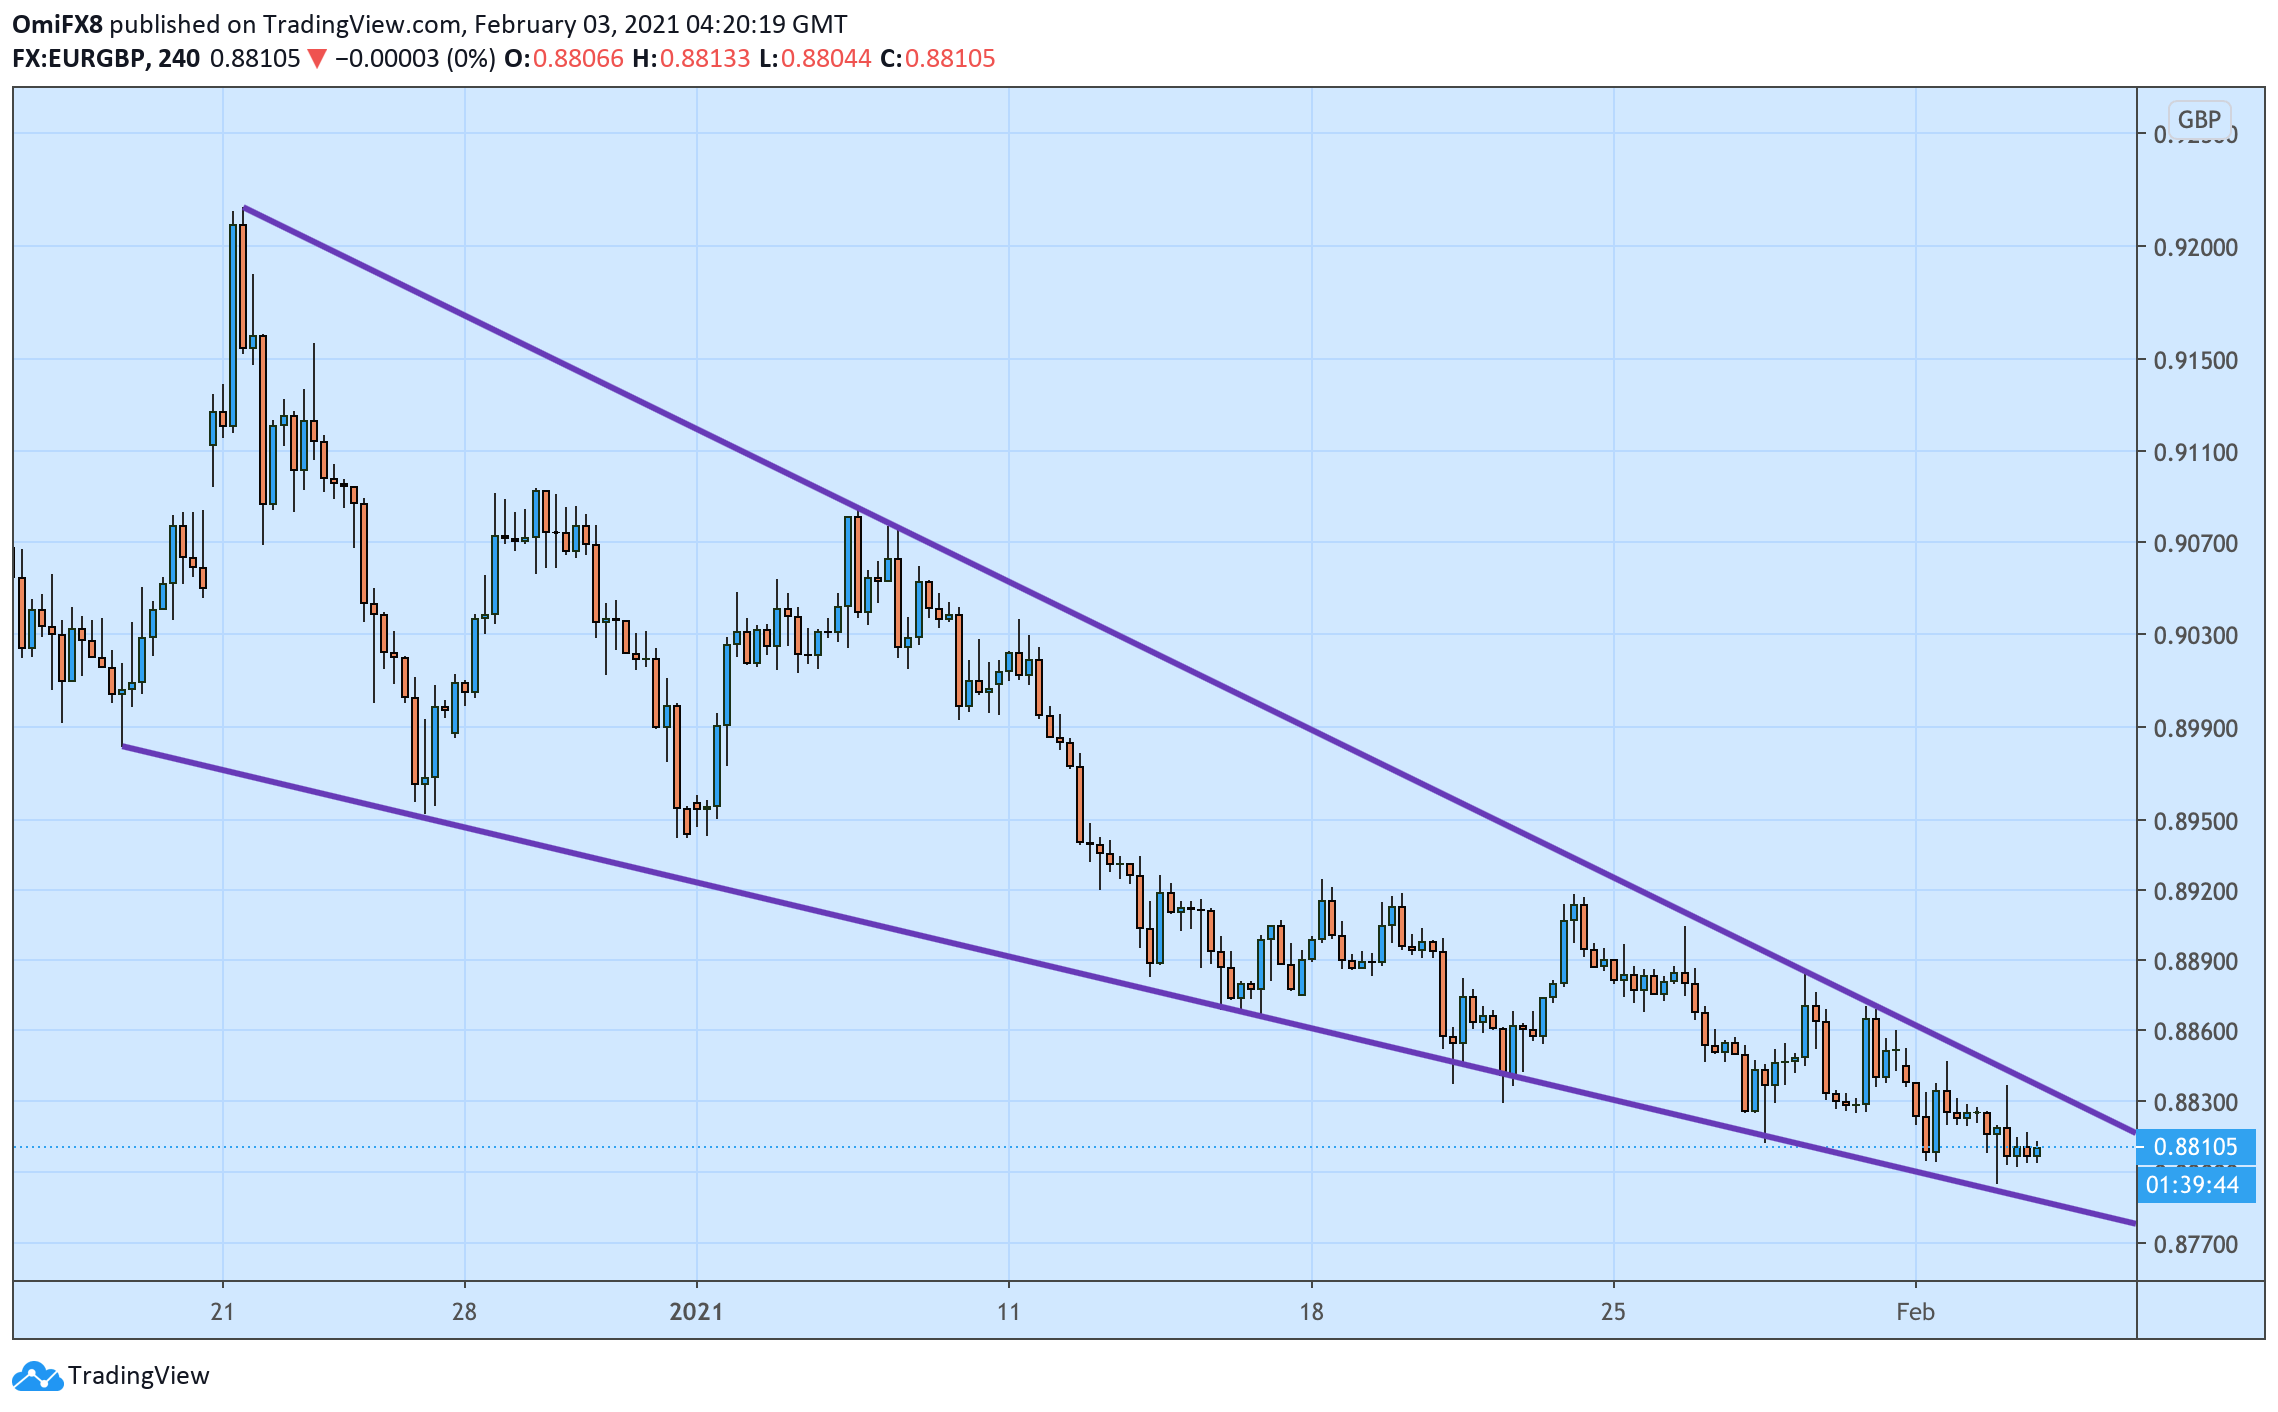
Trend: Bullish above wedge resistance
Technical levels