Back
6 Nov 2019
USD/CHF technical analysis: Greenback hanging near the November highs against CHF
- USD/CHF is trading flat on the day, consolidating the gains of the last two days.
- The level to beat for bulls is the 0.9940/0.9956 resistance zone.
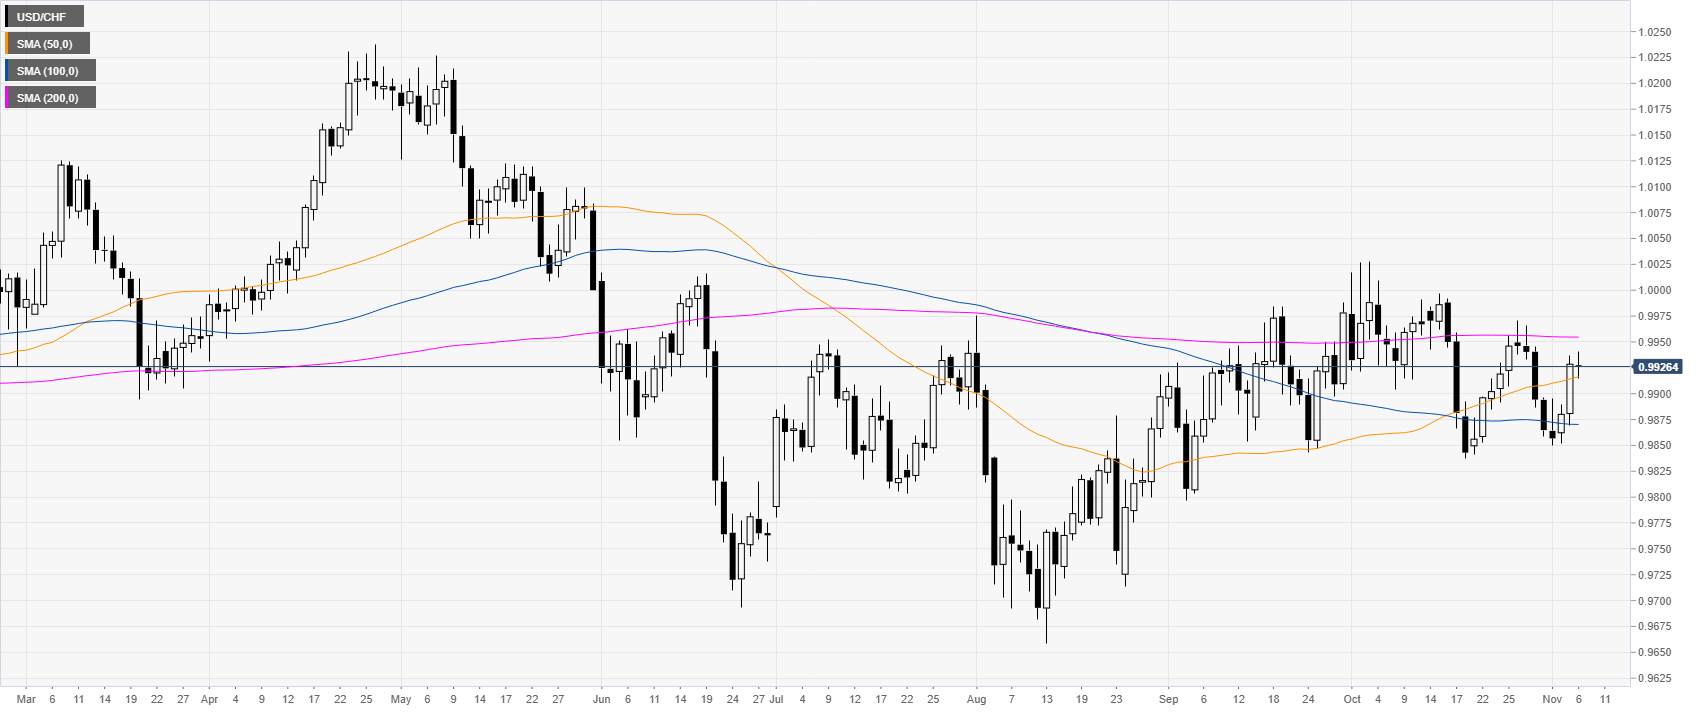
USD/CHF daily chart
On the daily chart, USD/CHF is trading in a range below its 200-day simple moving average (DMA). The market is holding just above the 50 SMA today at the 0.9916 level.
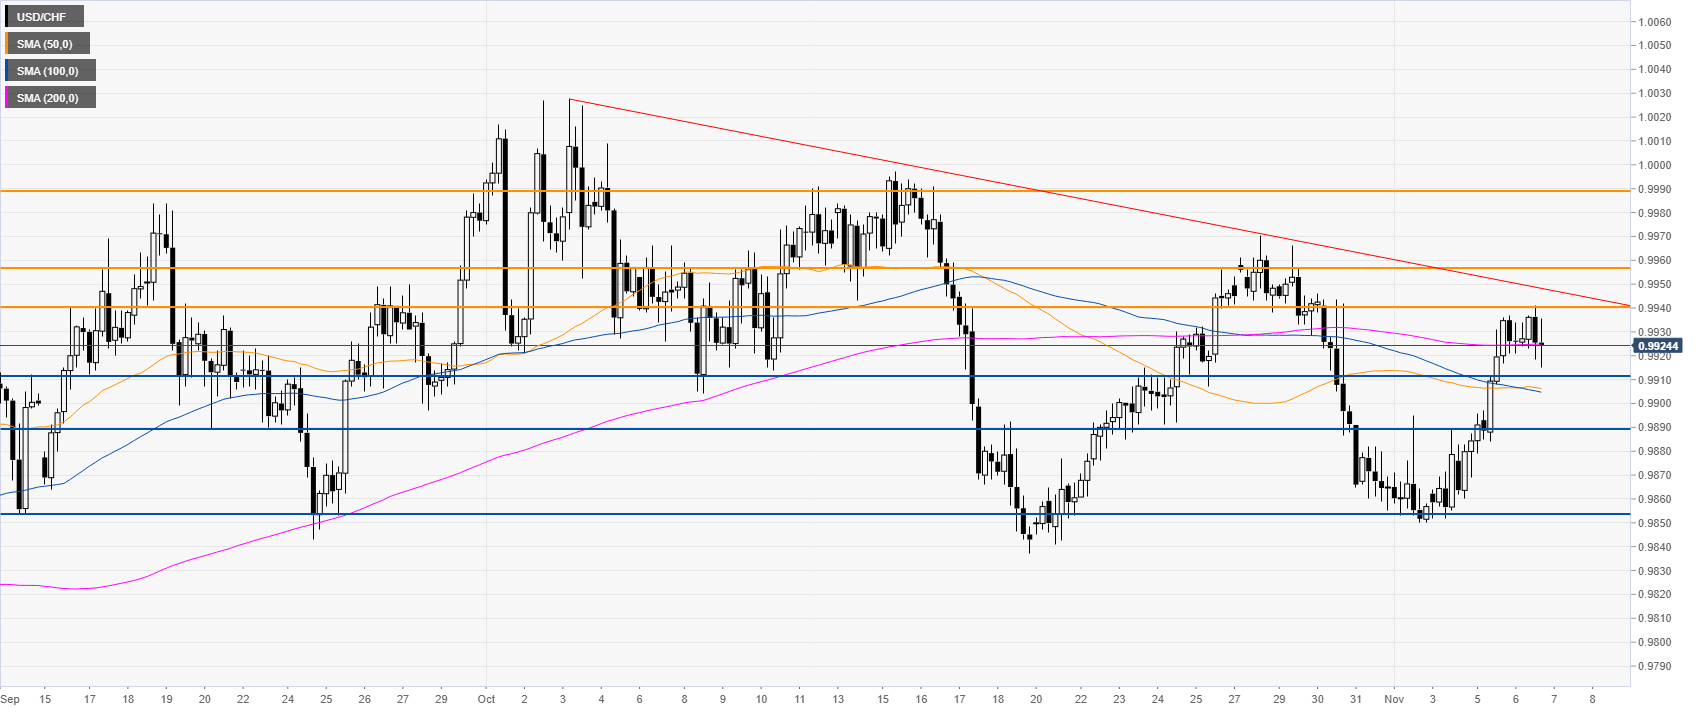
USD/CHF four-hour chart
USD/CHF is trading near the monthly highs while above its main SMAs, suggesting a bullish bias in the medium term. Buyers will need to overcome the 0.9940/0.9956 resistance zone and the descending trendline. Further up, 0.9988 resistance awaits, according to the Technical Confluences Indicator.
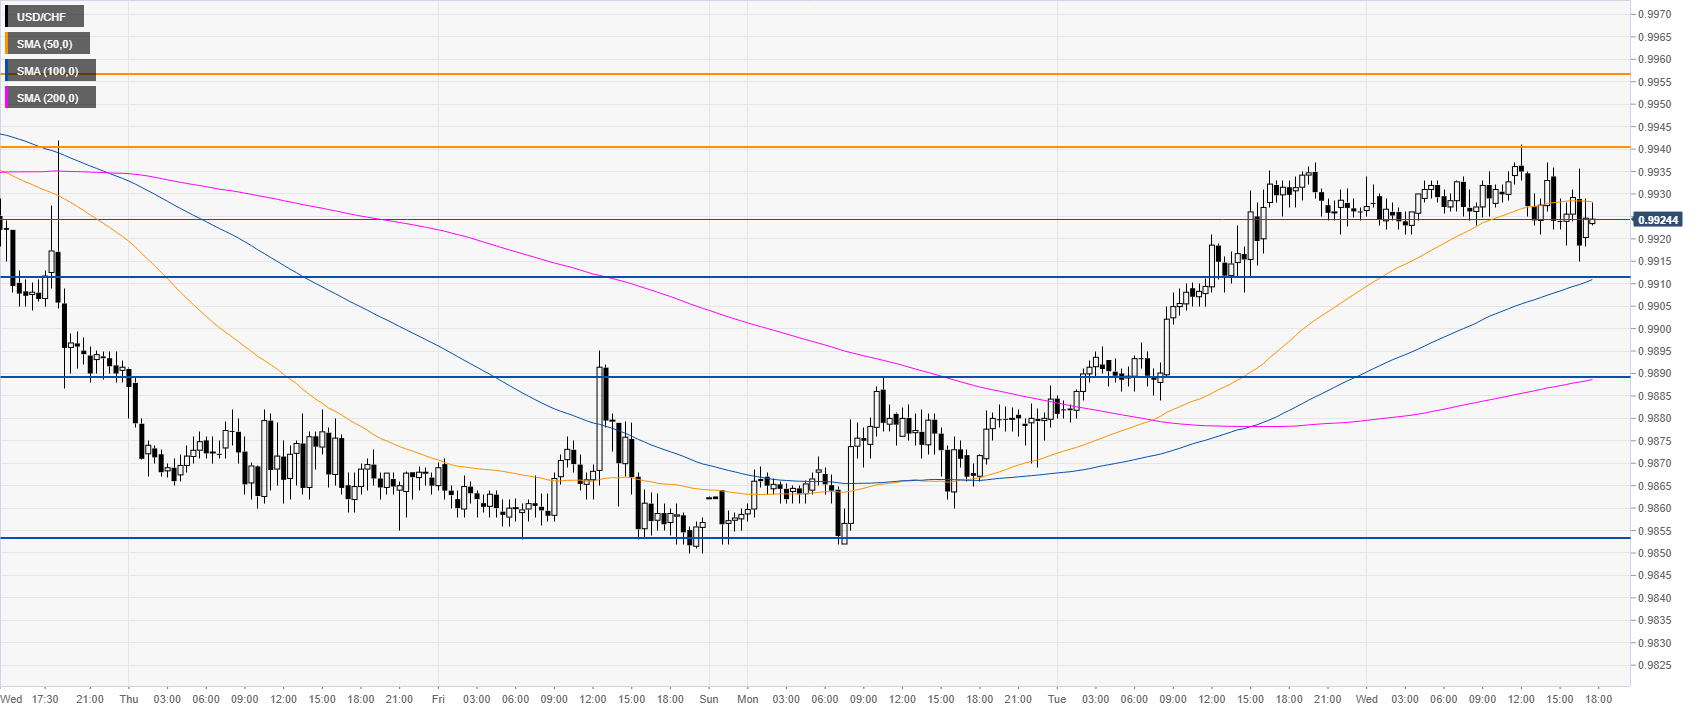
USD/CHF 30-minute chart
USD/CHF is trading above upward sloping 100/200 SMAs, suggesting a bullish bias in the medium term. Pullbacks down could find support near 0.9910, 0.9889 and 0.9853, according to the Technical Confluences Indicator.
Additional key levels