Back


6 Nov 2019
GBP/USD technical analysis: Cable getting ready for something nasty?
- GBP/USD is stuck in a range this Wednesday trading below the 1.2900 handle.
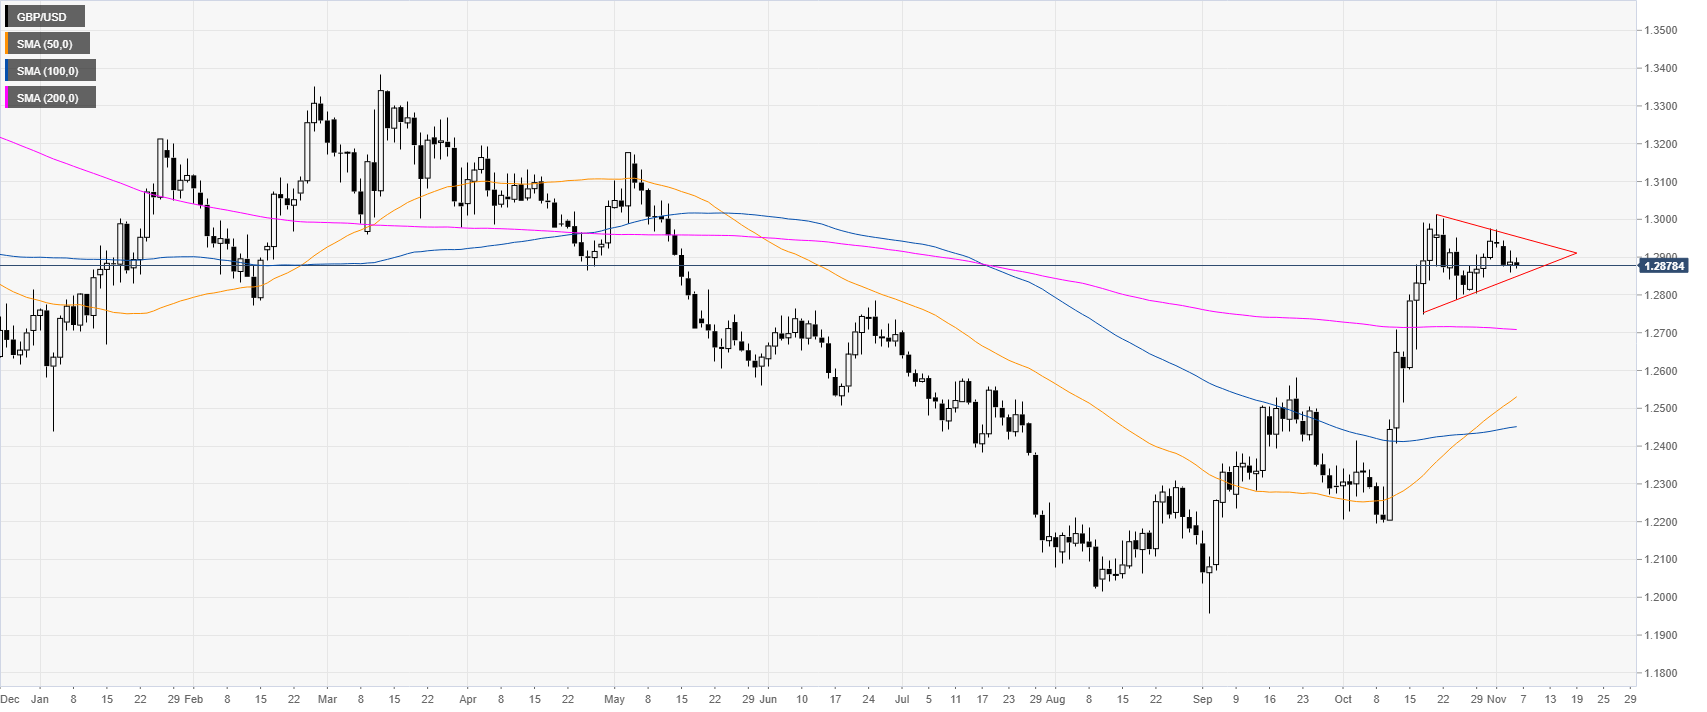
- GBP/USD is trapped in a triangle on the daily chart.
- Considering the Brexit drama, this can lead to a surprising move in either direction.
GBP/USD daily chart
In October, GBP/USD soared above the main daily simple moving averages (DMAs) and reached levels not seen since mid-May 2019. The Cable is currently trapped in a triangle pattern which can lead to significant moves in either direction as the Brexit drama unfolds.

GBP/USD four-hour chart
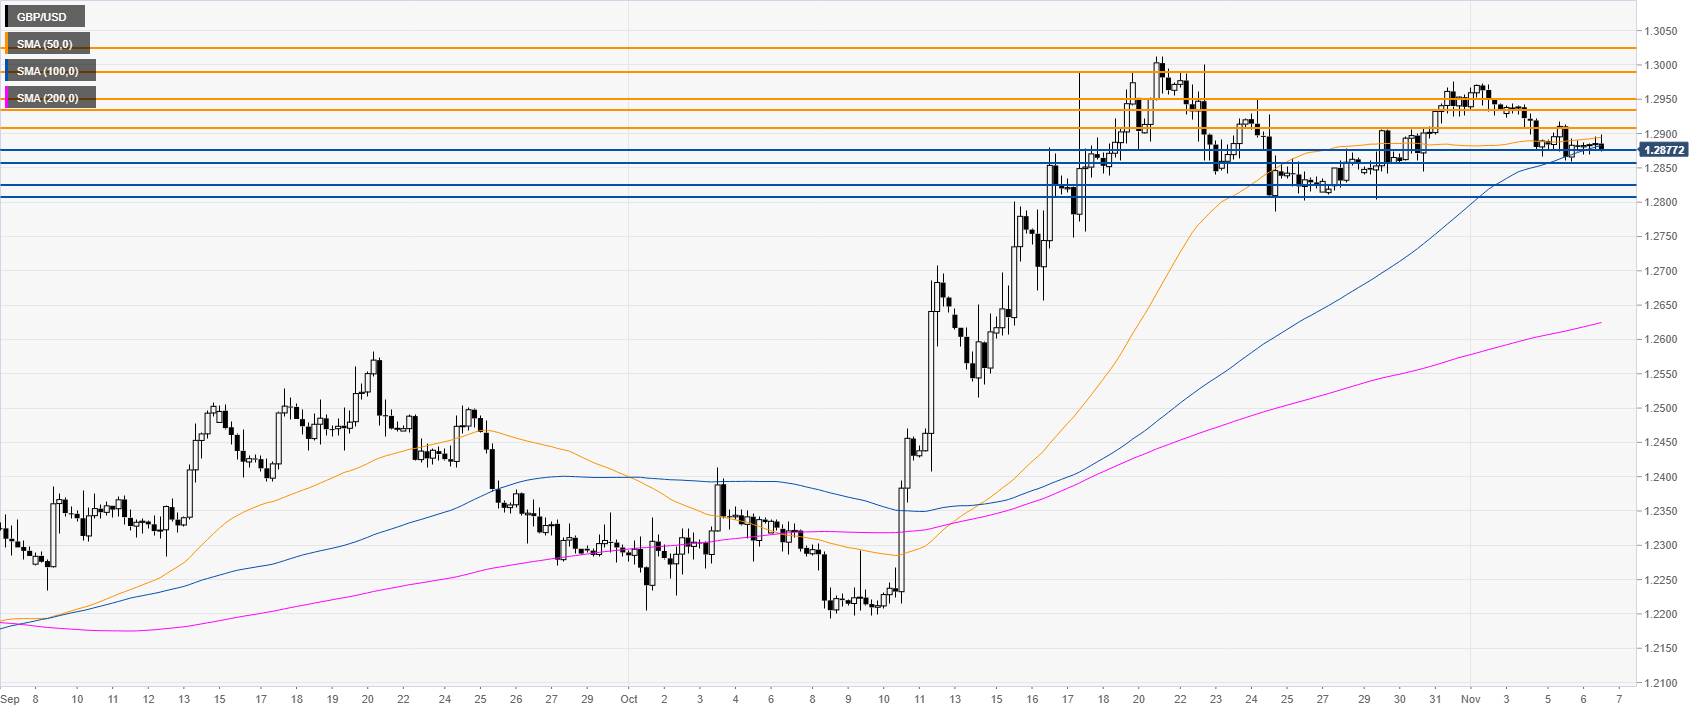
GBP/USD is easing from the October and November highs while trading just below the 50 and 100 SMAs. The Cable is losing momentum suggesting that sellers might try to reach the 1.2887, 1.2860, 1.2825 and 1.2807 support levels on the way down, according to the Technical Confluences Indicator.

GBP/USD 30-minute chart
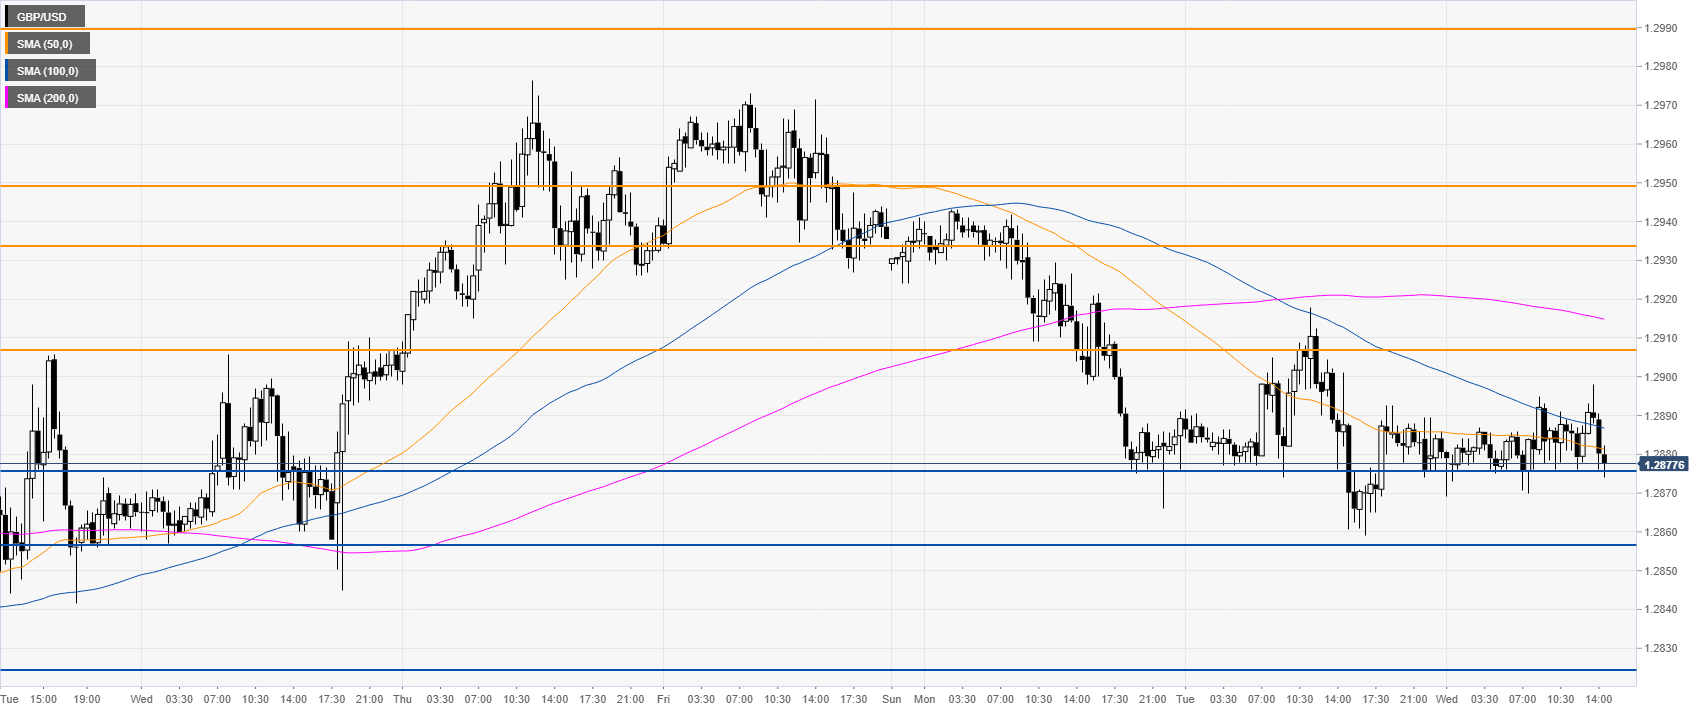
Sterling/Dollar is ranging this Wednesday while trading below its main SMAs. Immediate resistance is seen at the 1.2906 and the 1.2933 levels, according to the Technical Confluences Indicator.

Additional key levels
