GBP/USD technical analysis: 100-hour SMA, 1-week-old falling trendline limits immediate upside
- GBP/USD remains above 1.2800 ever since it recovered from the same on Thursday.
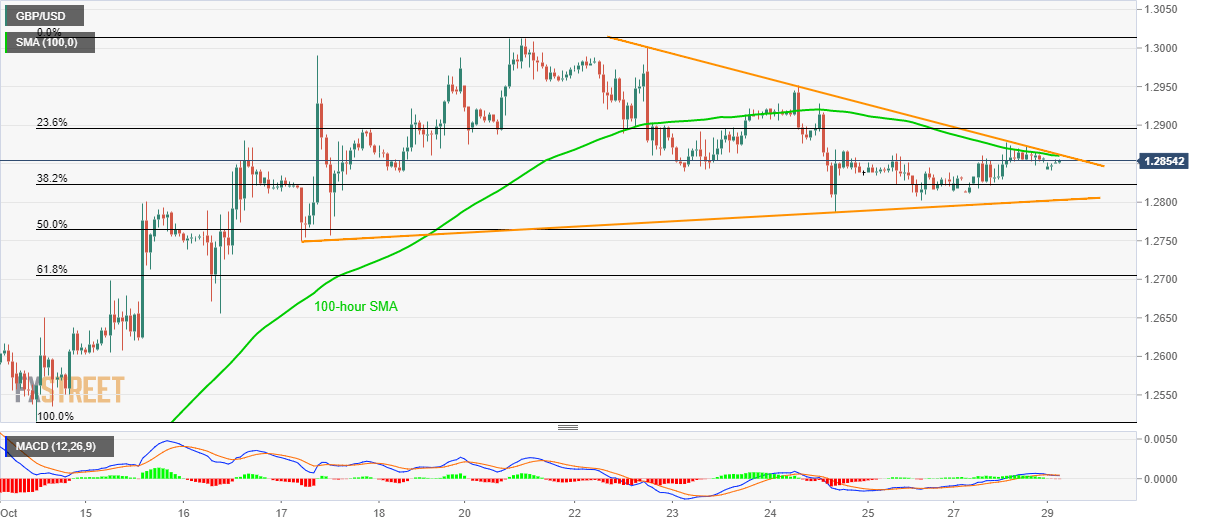
- A near-term symmetrical triangle formation could challenge bearish MACD.
Although the recent trading pattern of the GBP/USD pair portrays weakness, the quote stays above 1.2800 mark, not to mention the continuation of the immediate symmetrical triangle. By the press time of Pre-London open on Tuesday, the quote takes the bids to 1.2855.
The pair needs to rise past-100-hour Simple Moving Average (SMA) and one-week-old falling trend line, around 1.2860/62, to aim for weekly top close to 1.2950 and the monthly high near 1.3013.
Alternatively, pair’s declines below an ascending trend line since October 17, at 1.2800 now, could justify bearish signals from 12-bar Moving Average Convergence and Divergence (MACD).
In doing so, 1.2750 and 61.8% Fibonacci retracement of current month advances, at 1.2704, will be sellers’ immediate choice.
Also, the pair’s extended downpour below 1.2700 seems to pave the pair’s downpour to 1.2620 and 1.2560 numbers to the south.
GBP/USD hourly chart
Trend: sideways