Back
28 Oct 2019
EUR/USD technical analysis: Euro trading below 1.1100 handle in the New York session
- The Euro is having a mixed start to the week, hovering mainly below 1.1105 resistance.
- The level to beat for bears is the 1.1065/1.1040 support zone.
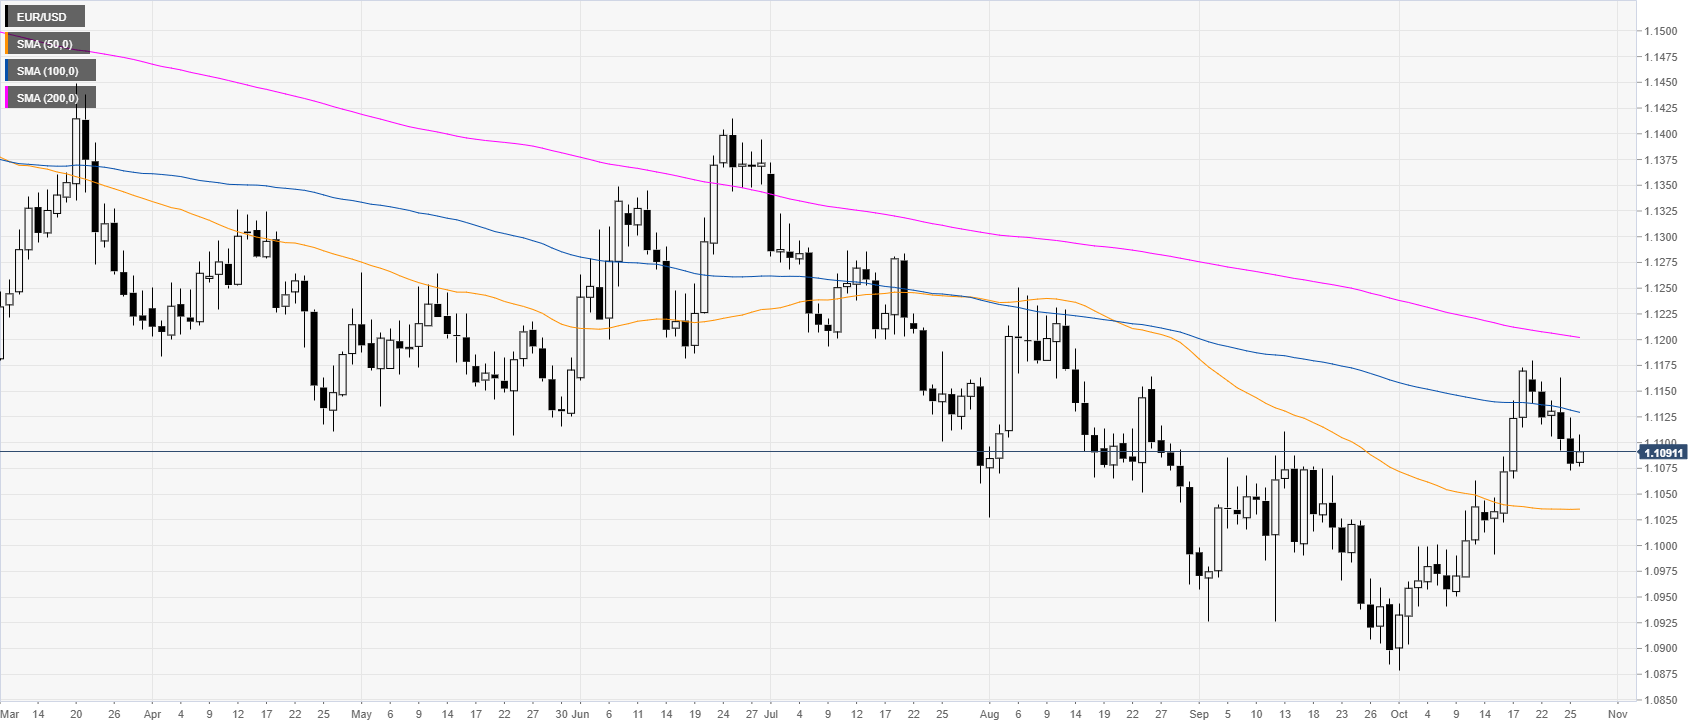
EUR/USD daily chart
On the daily chart, the shared currency is trading in a bear trend below the 100 and 200-day simple moving averages (DMAs). Last week, EUR/USD registered its worst weekly decline since late September this year.
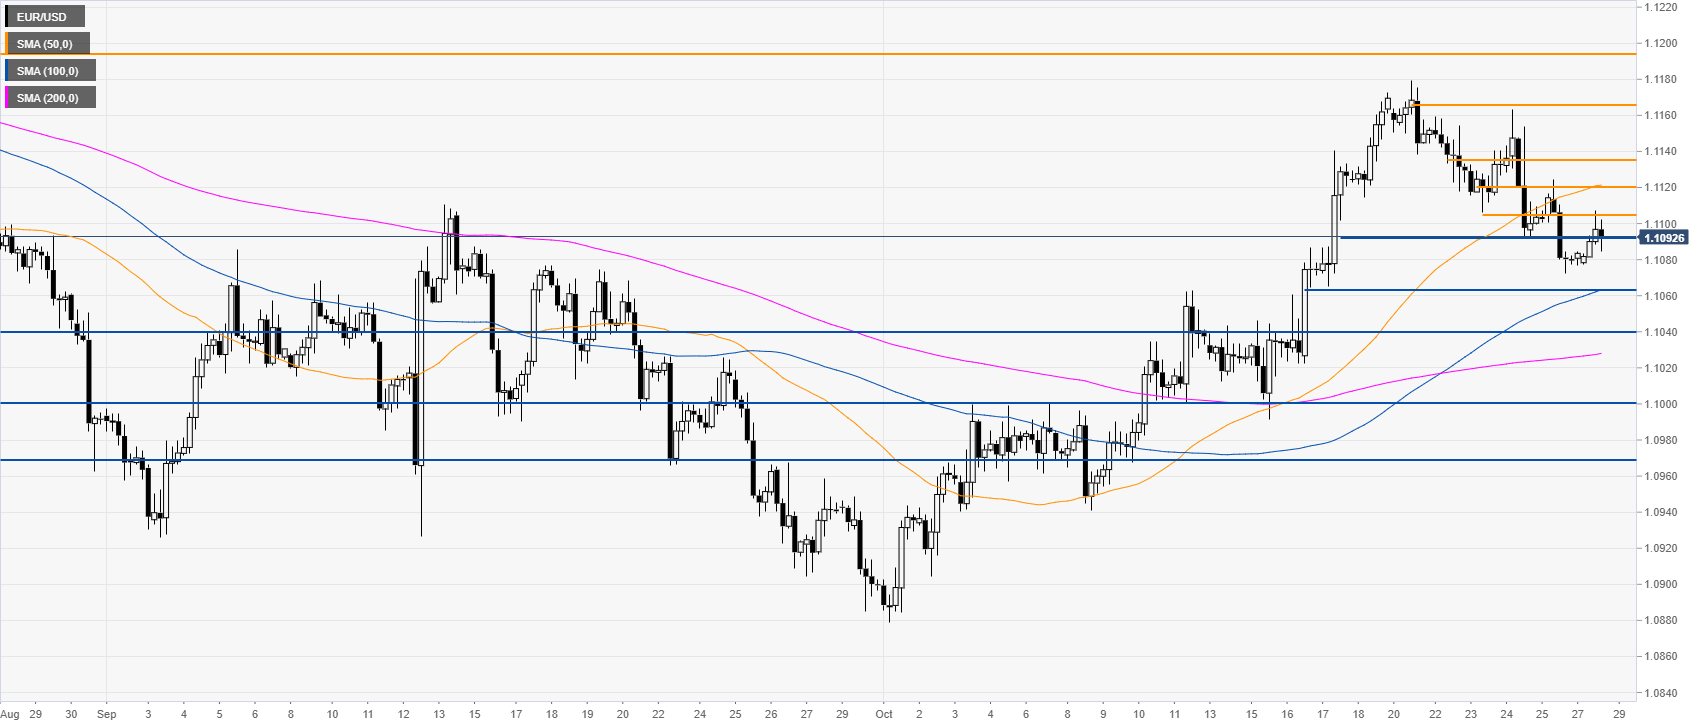
EUR/USD four-hour chart
The Euro, on the four-hour chart, is trading above the 100 and 200 SMAs. However, the spot is pulling back down, trading below its 50 SMA. The level to beat for bears is the 1.1065/1.1040 support zone, according to the Technical Confluences Indicator. A break below this area can send EUR/USD down to the 1.1000/1.0970 support zone.
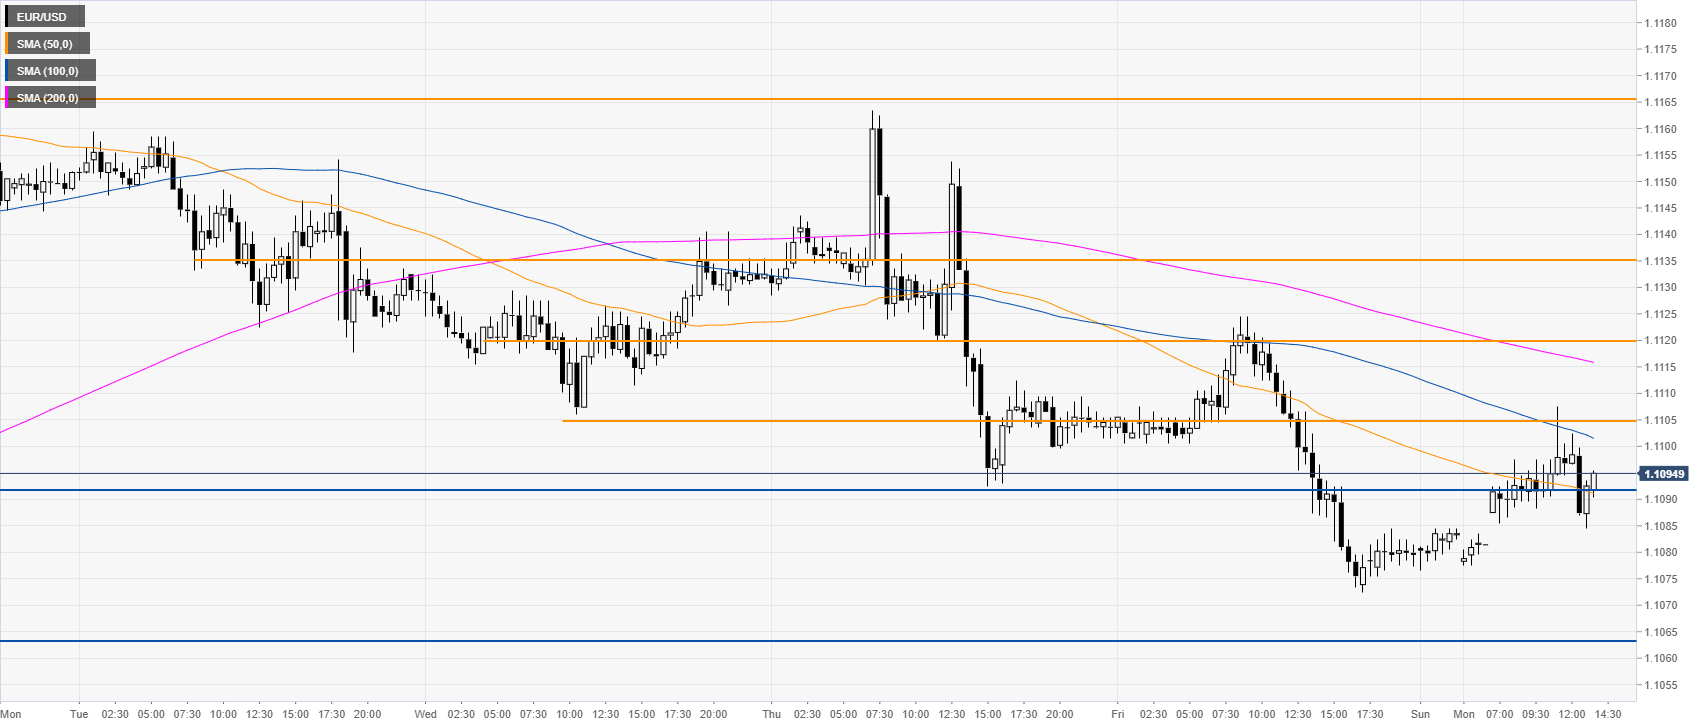
EUR/USD 30-minute chart
The exchange rate is trading below the 100 and 200 SMAs on the 30-minute chart, suggesting a bearish bias in the near term. Resistance can be seen at the 1.1105 and 1.1120 price levels.
Additional key levels