Back
24 Sep 2019
GBP/USD technical analysis: Cable running out of steam below the 1.2500 handle
- GBP is among the worst performers this Monday.
- The level to beat for sellers is the 1.2417 support level.
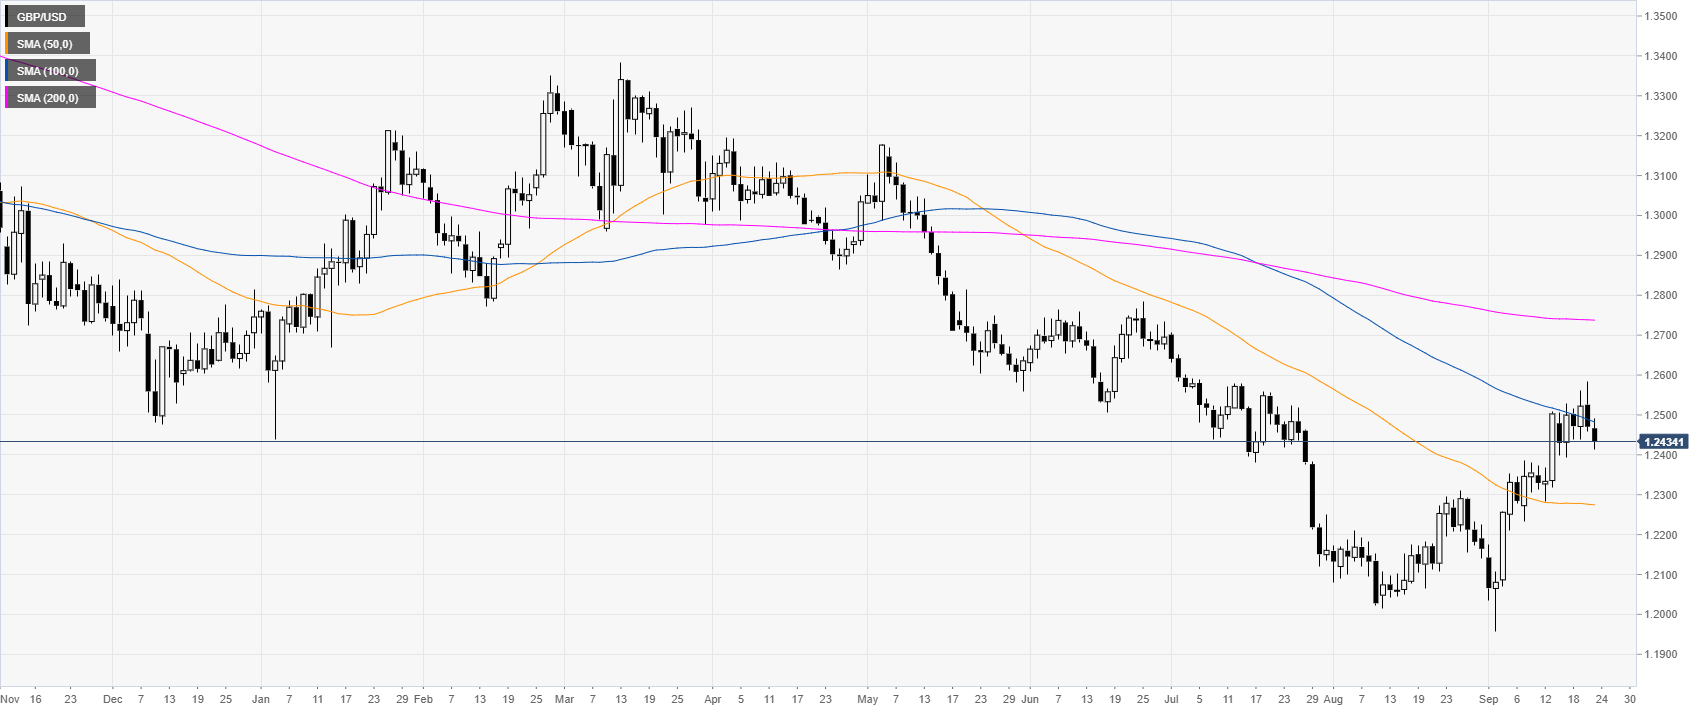
GBP/USD daily chart
The Sterling is trading is in a downtrend below the 100 and 200-day simple moving averages (SMAs). The market is currently rejecting the 1.2500 handle and the 100 SMA.
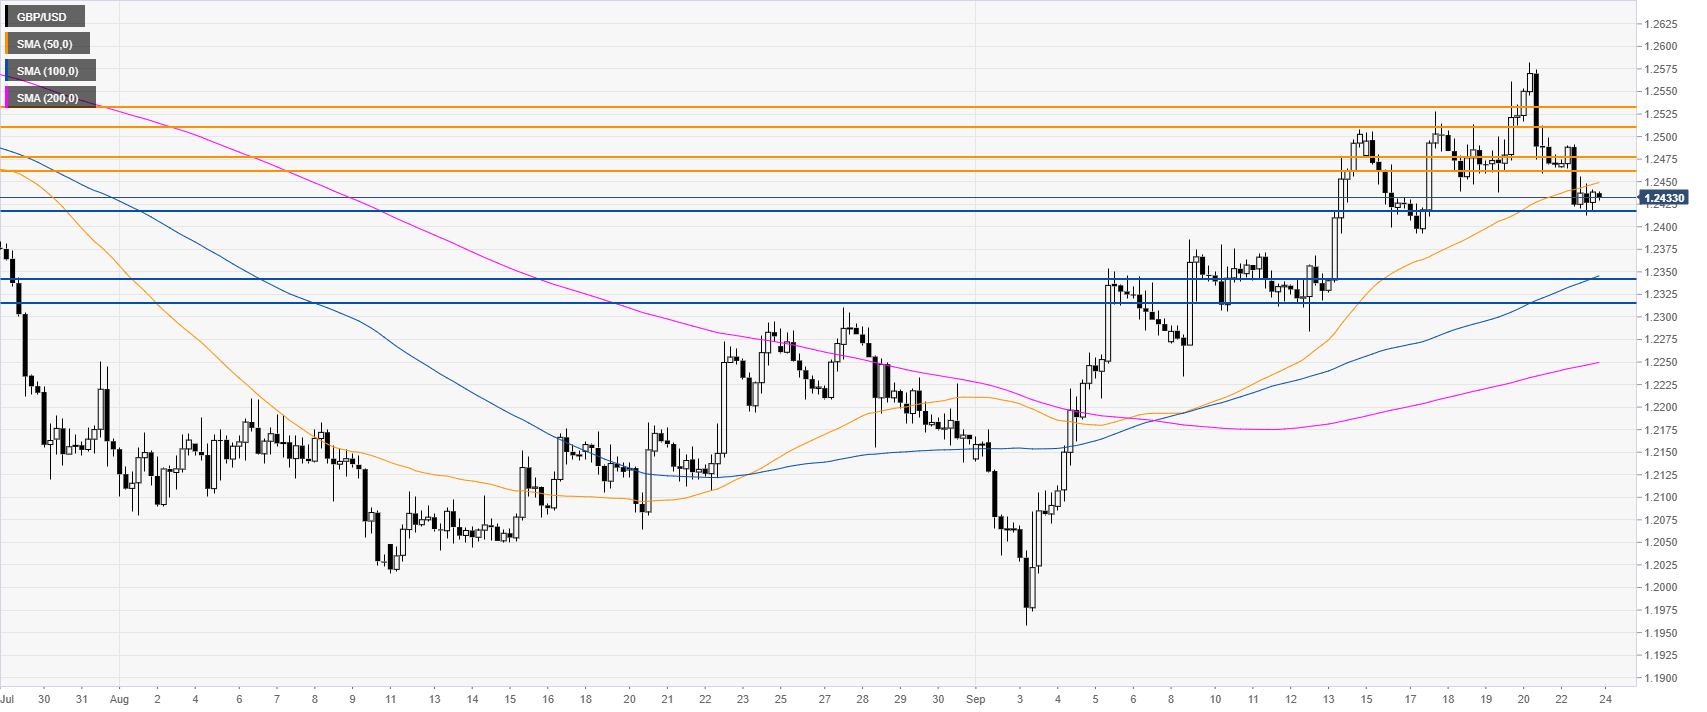
GBP/USD four-hour chart
GBP/USD is stabilizing above the 1.2417 support while trading below the 50 SMA. A downside break of 1.2417 can expose 1.2340 and 1.2317 price levels, according to the Technical Confluences Indicator.
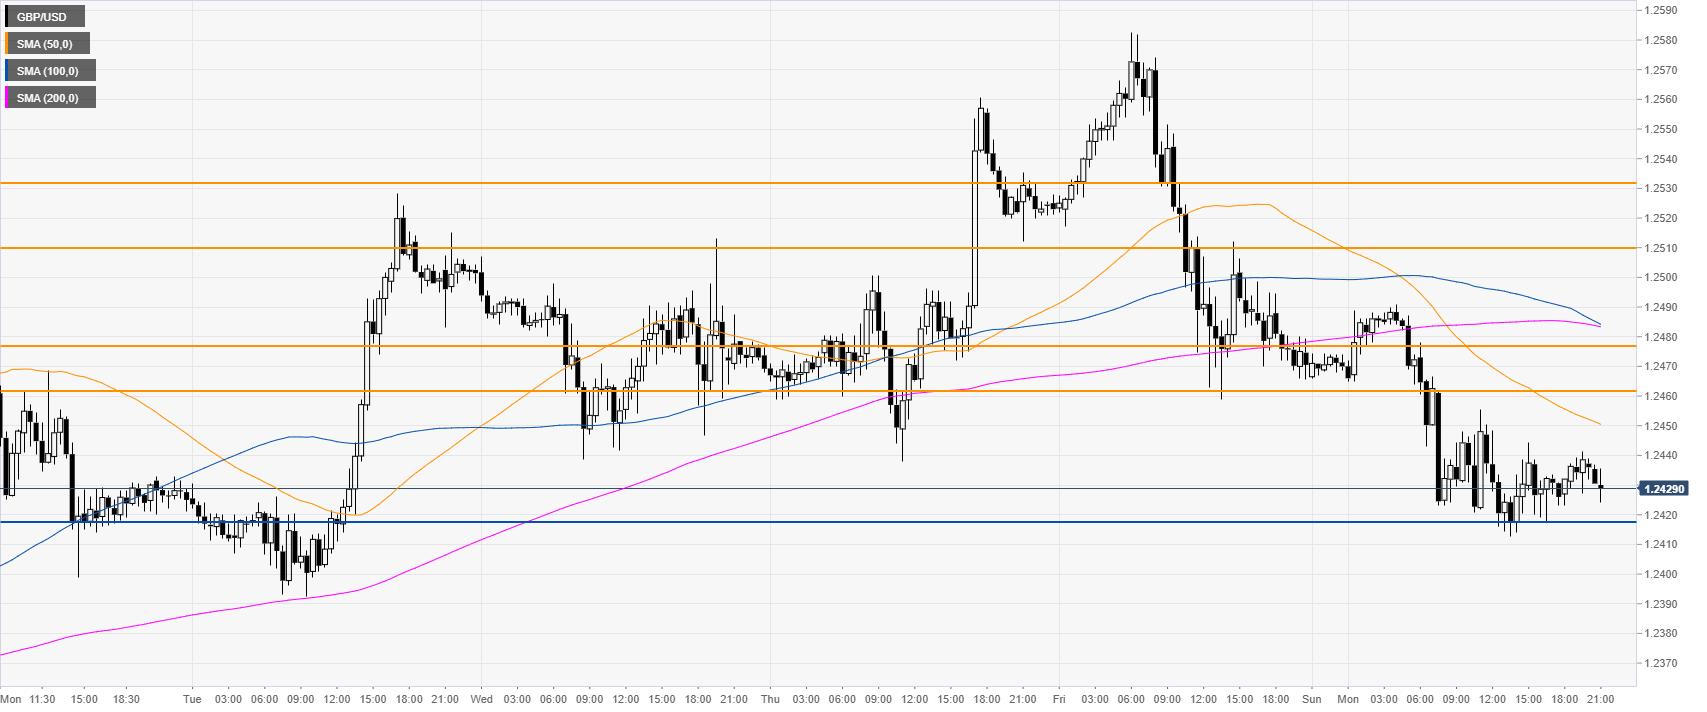
GBP/USD 30-minute chart
The Pound is trading below its main SMAs, suggesting a bearish momentum in the near term. Immediate resistance can be at 1.2560/1.2465 zone followed by 1.2510 price level, according to the Technical Confluences Indicator.
Additional key levels