EUR/USD Technical Analysis: Euro near 1.1350 ahead of ECB Minutes
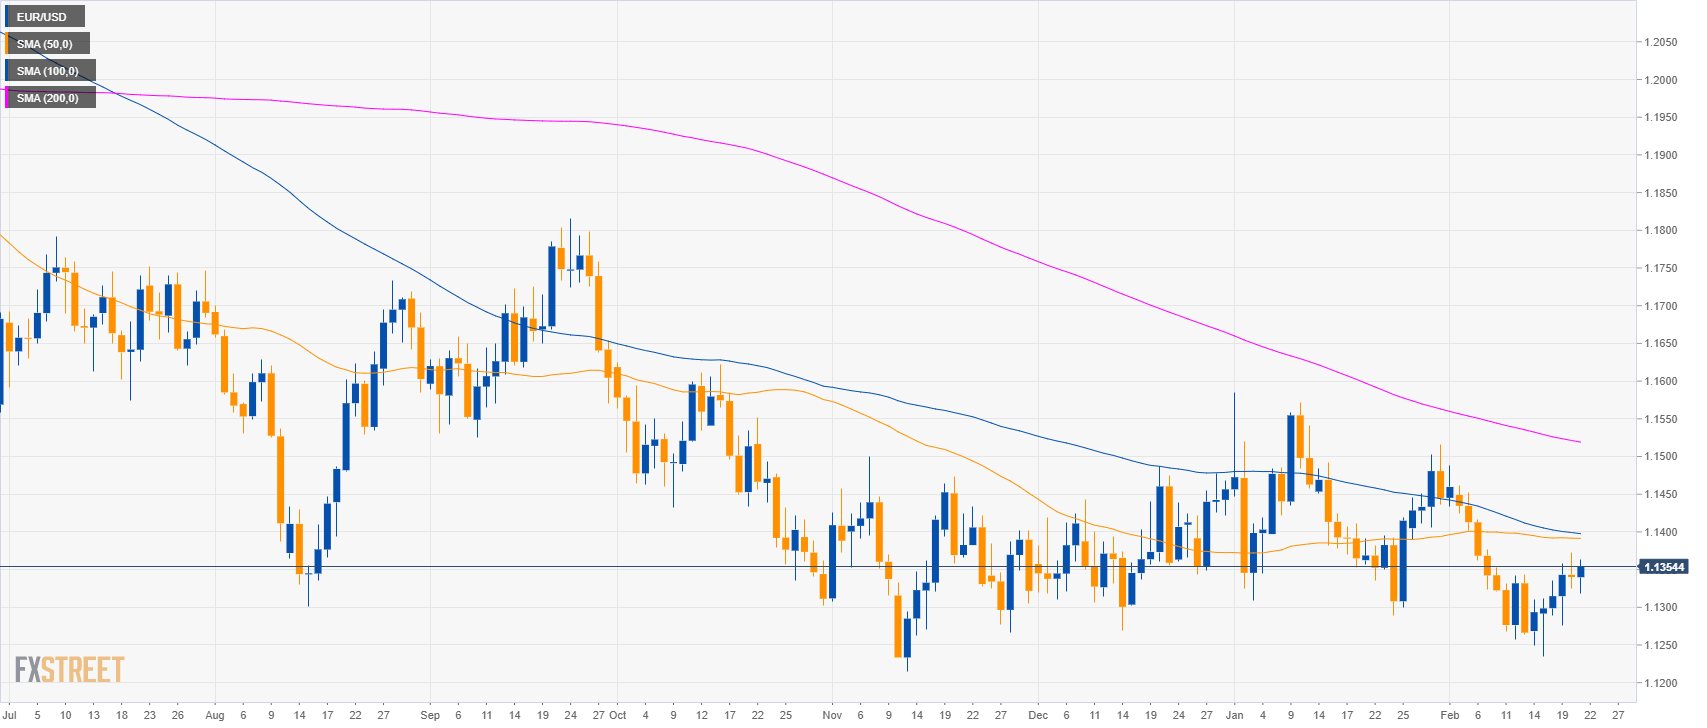
EUR/USD daily chart
- EUR/USD is evolving in a bear trend below the 200-day simple moving average (SMA).
- The ECB (European Central Bank) Minutes at 12.30 GMT can potentially provide high volatility in the financial markets.
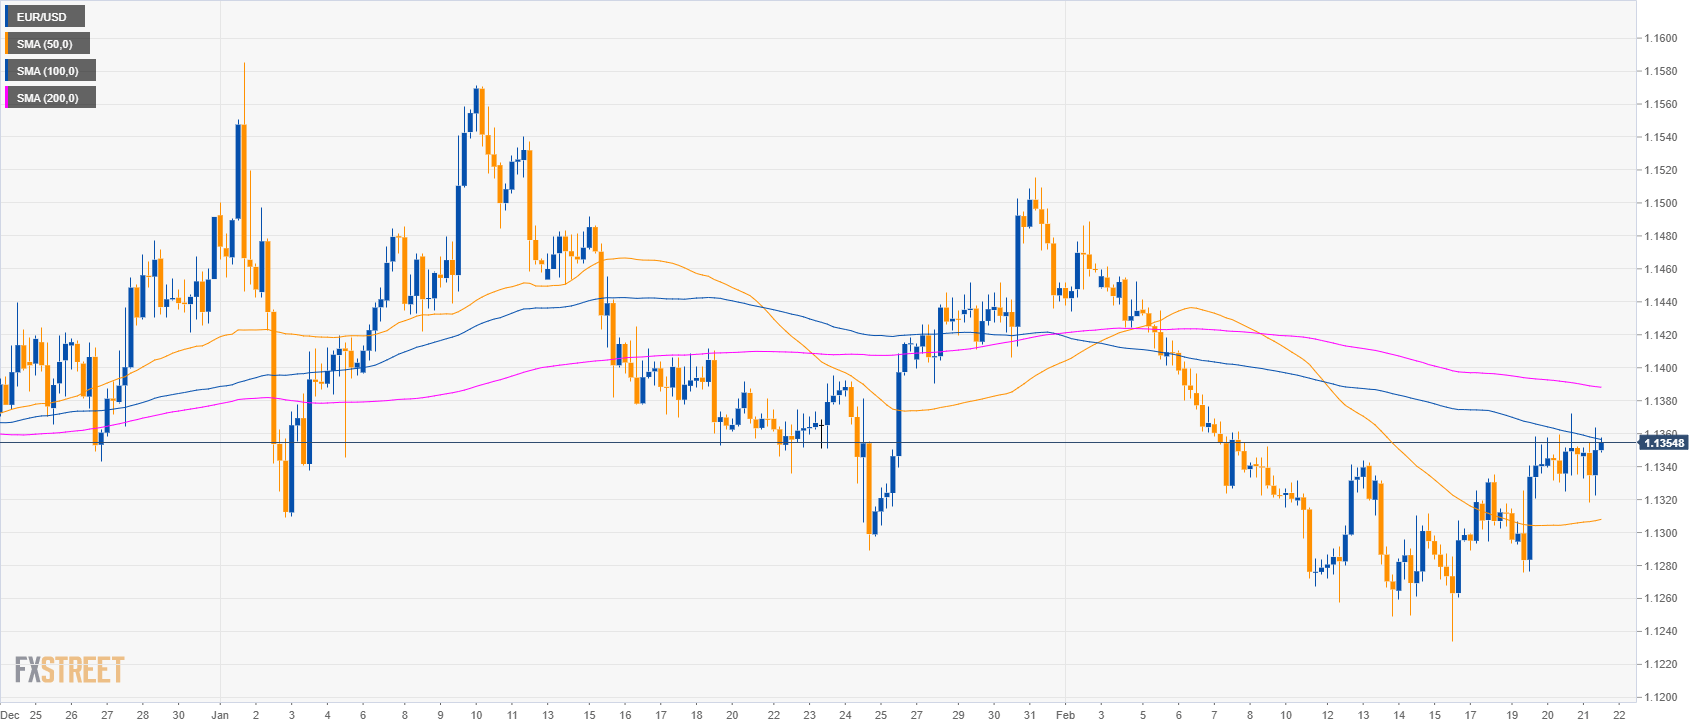
EUR/USD 4-hour chart
- EUR/USD is currently testing the 100 SMA.
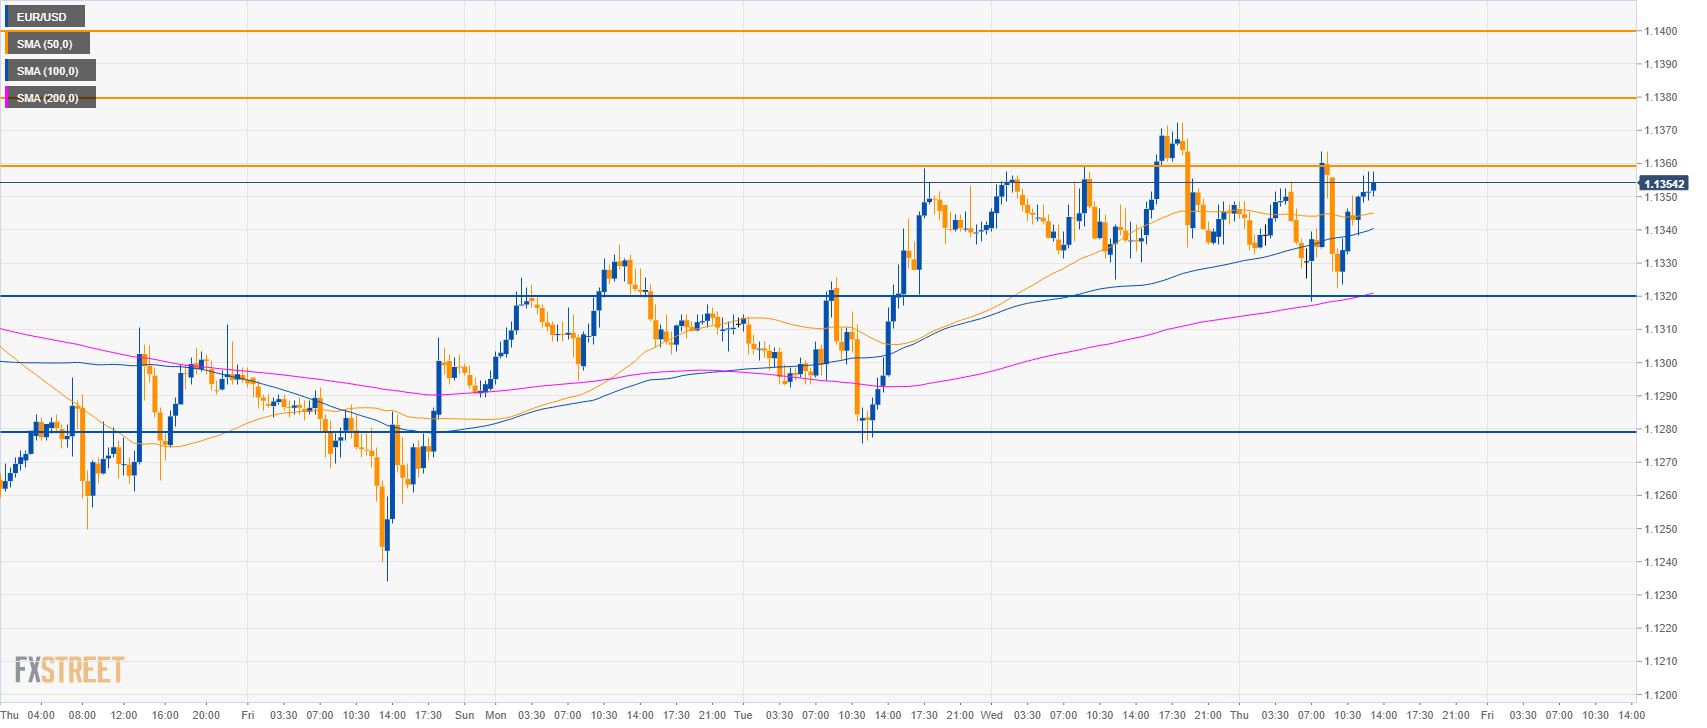
EUR/USD 30-minute chart
- EUR/USD is trading above its main SMAs suggesting bullish momentum.
- A break above 1.1360 should reach 1.1380 and 1.1400 figure to the upside.
- Looking down, support is at 1.1320 and 1.1280 key level.
Additional key levels:
EUR/USD
Overview:
Today Last Price: 1.1354
Today Daily change: 14 pips
Today Daily change %: 0.12%
Today Daily Open: 1.134
Trends:
Daily SMA20: 1.1366
Daily SMA50: 1.1392
Daily SMA100: 1.1399
Daily SMA200: 1.1521
Levels:
Previous Daily High: 1.1373
Previous Daily Low: 1.1325
Previous Weekly High: 1.1344
Previous Weekly Low: 1.1234
Previous Monthly High: 1.1586
Previous Monthly Low: 1.1289
Daily Fibonacci 38.2%: 1.1343
Daily Fibonacci 61.8%: 1.1354
Daily Pivot Point S1: 1.1319
Daily Pivot Point S2: 1.1298
Daily Pivot Point S3: 1.1272
Daily Pivot Point R1: 1.1367
Daily Pivot Point R2: 1.1393
Daily Pivot Point R3: 1.1414