NZD/USD Technical Analysis: 0.6700 back in focus now
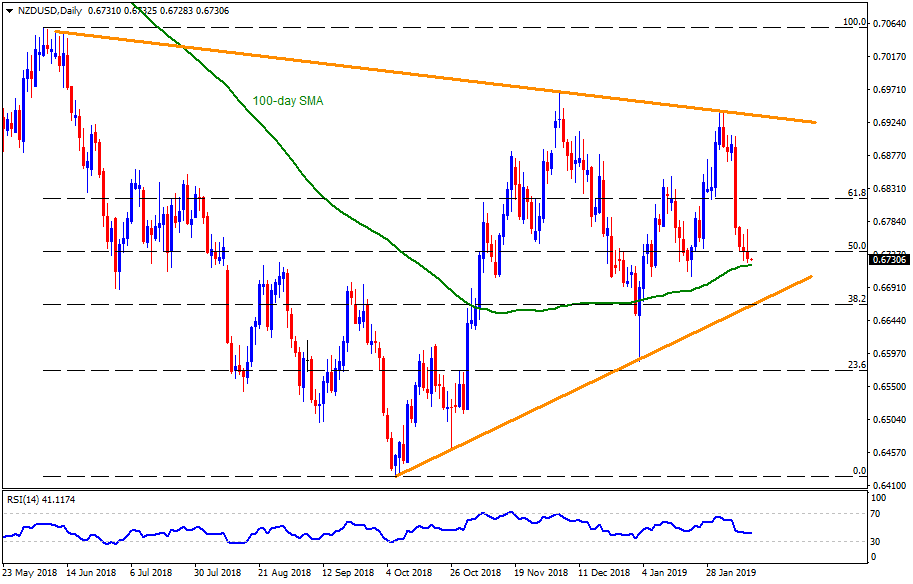
NZD/USD daily chart
- The NZD/USD pair trades around 0.6730 at the start of Tuesday’s Asian trading.
- The 100-day simple moving average (SMA) near 0.6720 can offer immediate support to the pair’s decline prior to highlighting the 0.6700 round-figure.
- However, an upward sloping trend-line connecting lows since October 2018, at 0.6660 now, could limit the pair’s downside past 0.6700.
- On the upside, the 0.6775 and the 61.8% Fibonacci Retracement of its June-October downturn, at 0.6815, seem crucial resistances to watch.
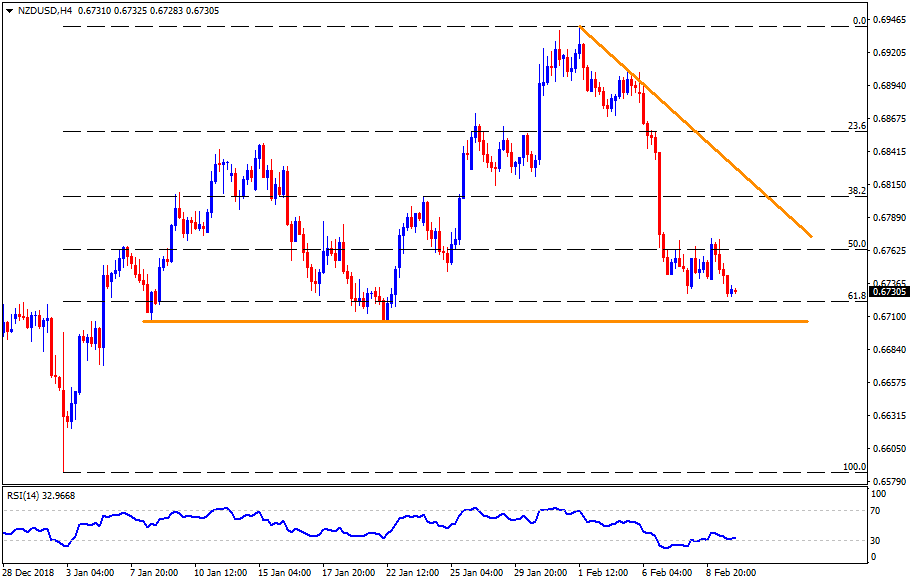
NZD/USD 4-Hour chart
- While 100-day SMA offers immediate support on D1, the H4 chart clearly portrays the importance of 0.6705-0.6700 support area connecting the lows marked in January 08 and 22.
- Should the pair drops under 0.6700, the 0.6670 and 0.6620 may offer additional supports other than 0.6660 conveyed on daily chart.
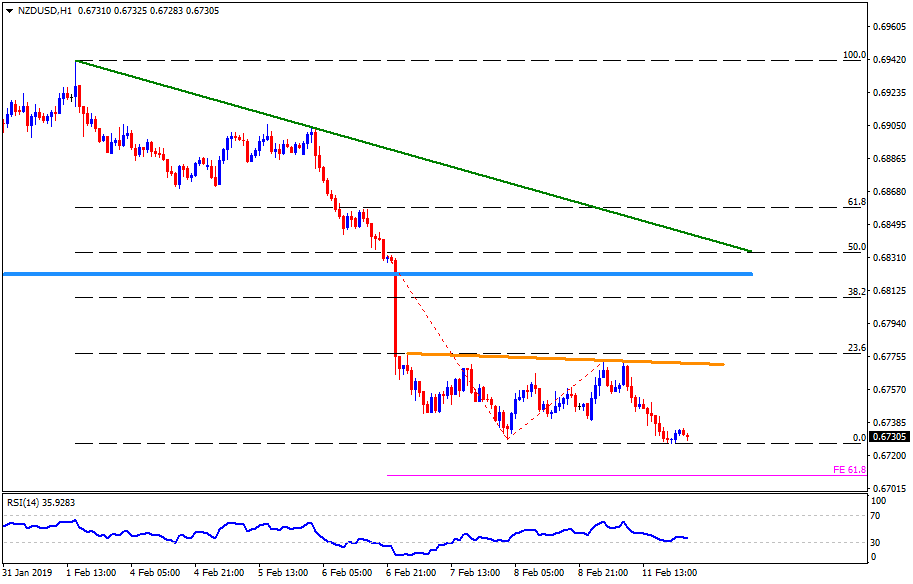
NZD/USD hourly chart
- On H1, prices can avail 0.6725 as adjacent rest before slipping to 0.6710 level including 61.8% Fibonacci expansion of its recent slump.
- Meanwhile, the 0.6740 and the descending trend-line figure of 0.6770 can restrict the pair’s nearby upside.
Additional Important Levels:
NZD/USD
Overview:
Today Last Price: 0.6732
Today Daily change: -0.0017 pips
Today Daily change %: -0.25%
Today Daily Open: 0.6749
Trends:
Daily SMA20: 0.6813
Daily SMA50: 0.6799
Daily SMA100: 0.6724
Daily SMA200: 0.6757
Levels:
Previous Daily High: 0.6767
Previous Daily Low: 0.6729
Previous Weekly High: 0.6907
Previous Weekly Low: 0.6729
Previous Monthly High: 0.694
Previous Monthly Low: 0.6516
Daily Fibonacci 38.2%: 0.6744
Daily Fibonacci 61.8%: 0.6752
Daily Pivot Point S1: 0.673
Daily Pivot Point S2: 0.671
Daily Pivot Point S3: 0.6692
Daily Pivot Point R1: 0.6768
Daily Pivot Point R2: 0.6786
Daily Pivot Point R3: 0.6806