Gold Technical Analysis: Yellow Metal running to daily highs near 1,296.00 level
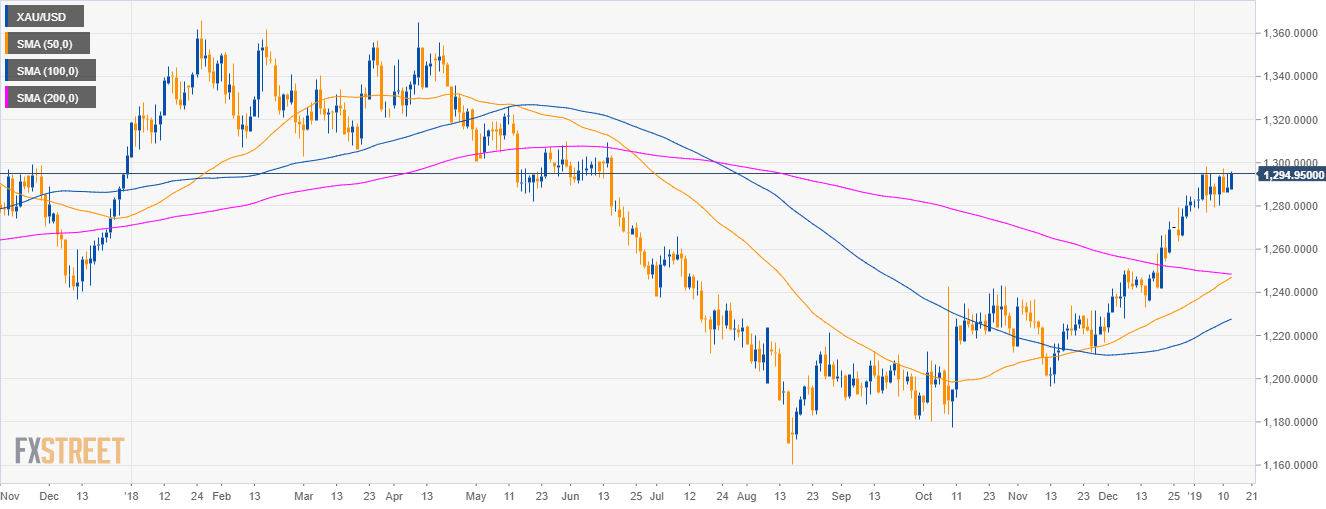
Gold daily chart
- Gold is trading in a bull trend above its main simple moving averages (SMAs).
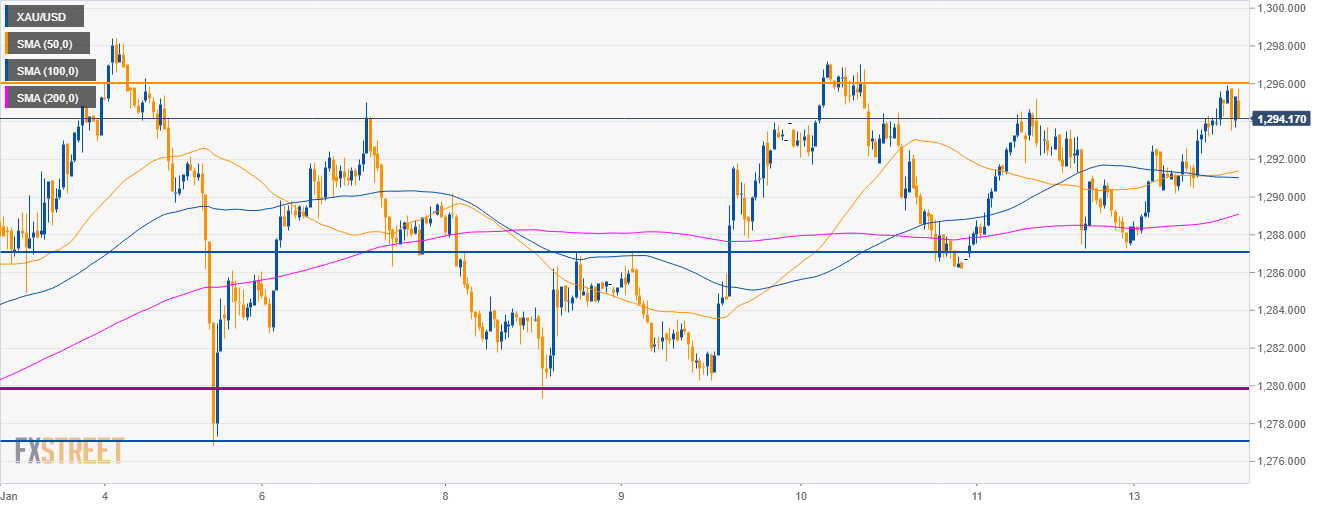
Gold 4-hour chart
- Gold is trading above its main SMAs suggesting bullish momentum in the near-term.
- The yellow metal is testing the 1,296.00 resistance.

Gold 30-minute chart
- Gold is set to depreciate against the US Dollar as the 1,296.00 resistance is capping prices.
- Bearish target at 1,287.00 level.
Additional key levels
XAU/USD
Overview:
Today Last Price: 1294.96
Today Daily change: 6.5e+2 pips
Today Daily change %: 0.504%
Today Daily Open: 1288.46
Trends:
Previous Daily SMA20: 1274.27
Previous Daily SMA50: 1244.74
Previous Daily SMA100: 1228.57
Previous Daily SMA200: 1229.03
Levels:
Previous Daily High: 1295.22
Previous Daily Low: 1286.2
Previous Weekly High: 1297.15
Previous Weekly Low: 1279.35
Previous Monthly High: 1284.7
Previous Monthly Low: 1221.39
Previous Daily Fibonacci 38.2%: 1291.77
Previous Daily Fibonacci 61.8%: 1289.65
Previous Daily Pivot Point S1: 1284.7
Previous Daily Pivot Point S2: 1280.94
Previous Daily Pivot Point S3: 1275.68
Previous Daily Pivot Point R1: 1293.72
Previous Daily Pivot Point R2: 1298.98
Previous Daily Pivot Point R3: 1302.74