Back
11 Sep 2018
USD/INR Technical Analysis: Minor pullback could be in the offing
- The bearish divergence of the hourly chart relative strength index (RSI) and the large bearish divergence of the 4-hour chart RSI indicates the pair could pull back to its ascending 50-hour moving average (MA) support, currently located at 72.11.
- The dip could be short-lived as the primary trend remains bullish, as indicated by the ascending 5-day and 10-day moving averages (MAs).
Hourly chart
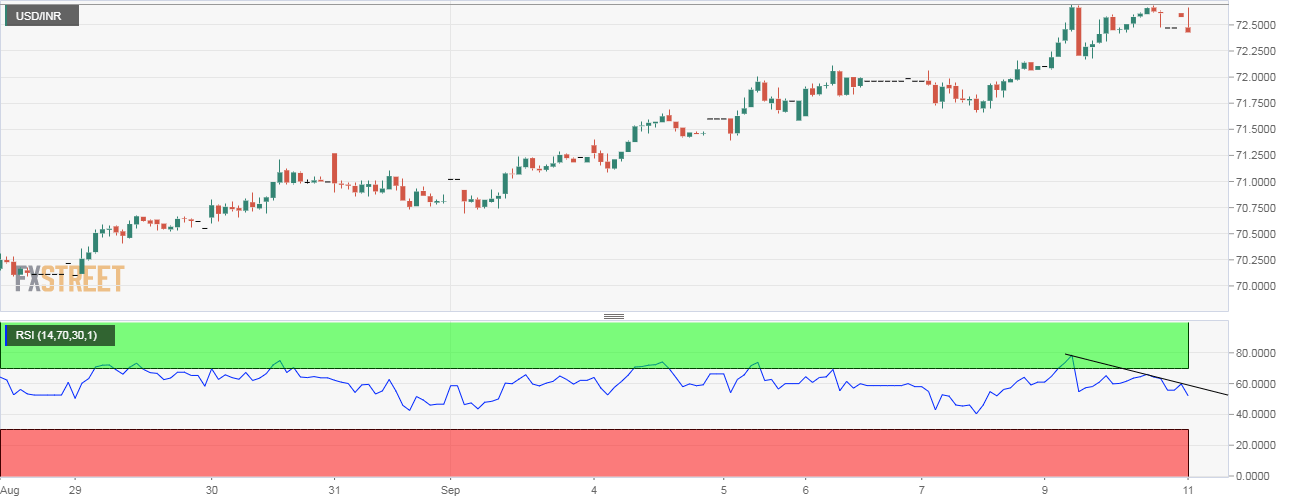
Spot Rate: 72.66
Recent High: 72.68
Previous day's Low: 72.08
Trend: Overbought, pullback likely
Resistance
R1: 72.68 (previous day's high)
R2: 73.00 (psychological level)
Support
S1: 72.19 (5-day moving average)
S2: 72.00 (psychological level)
S3: 71.59 (10-day moving average)