Gold Technical Analysis: Resurgent USD demand drags the commodity to 1-year low
• Overnight hawkish comments by the Fed Chair Jerome Powell remain supportive of resurgent USD demand and kept exerting downward pressure on the dollar-denominated commodity.
• Yesterday's fall below 200-week SMA marked a fresh bearish breakdown, with bears now looking for a subsequent weakness through a downward sloping trend-channel on the daily chart.
• Daily/hourly RSI (14) point to highly oversold conditions, albeit has failed to lend any support and stall the ongoing bearish momentum to the lowest level since July 2017.
Gold daily chart
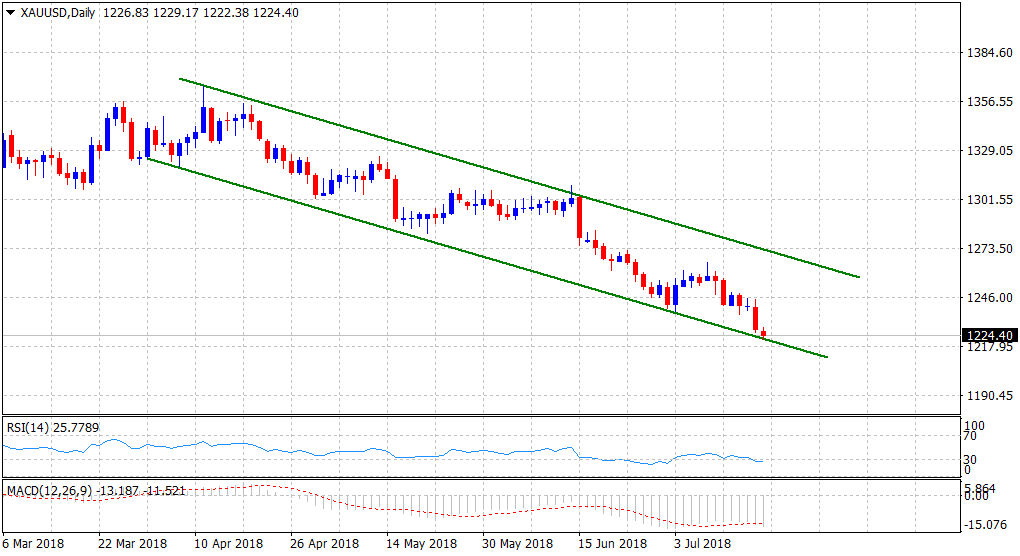
Spot rate: $1224.40
Daily Low: $1222.38
Daily High: $1229.17
Trend: Bearish
Resistance
R1: $1229 (current day swing high)
R2: $1234 (200-week SMA)
R3: $1238 (previous YTD swing low)
Support
S1: $1229 (July-14, 2017, daily closing low)
S2: $1220 (round figure)
S3: $1214 (horizontal zone)