Silver Price Analysis: XAG/USD flirts with daily low, holds above 38.2% Fibo. pivotal support
- Silver meets with some supply and erases a part of Friday’s strong gains to a two-week high.
- The technical setup supports prospects for the emergence of some dip-buying at lower levels.
- Sustained weakness back below the $22.30 area could pave the way for further intraday losses.
Silver (XAG/USD) kicks off the new week on a weaker note and erodes a part of Friday's strong move up to the $22.80 region, or a two-week high. The white metal maintains its offered tone through the early part of the European session and is currently placed just above mid-$22.00s, down over 0.70% for the day.
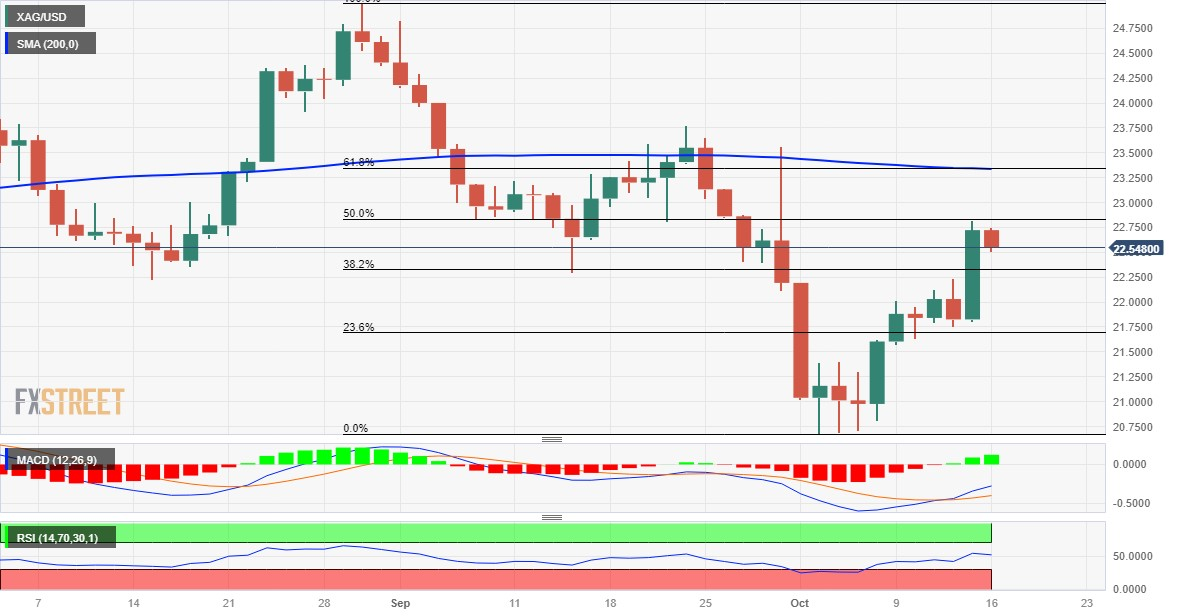
From a technical perspective, Friday's sustained breakout through a multi-day-old trading range and a subsequent move beyond the 38.2% Fibonacci retracement level of the August-October downfall favours bullish traders. Moreover, oscillators on the daily chart have just started gaining positive traction and support prospects for the emergence of some dip-buying near the $22.30 area and remain limited.
Some follow-through selling, however, could turn the XAG/USD vulnerable to weaken further below the $22.00 mark, towards the 23.6% Fibo. level, around the $21.75 area. Failure to defend the said support levels has the potential to drag the white metal further towards the $21.3-$21.30 intermediate support en route to the $21.00 mark and the $20.70-$20.65 zone, or a seven-month low touched earlier this month.
On the flip side, bulls might now wait for a move beyond the $22.80 region, or the 50% Fibo. level, before placing fresh bets. The XAG/USD might then surpass the $23.00 round-figure mark and climb further towards testing the $23.35 confluence, comprising the very important 200-day Simple Moving Average (SMA) and the 61.8% Fibo. level. A sustained move beyond will set the stage for a further appreciating move.
The subsequent move up has the potential to lift the XAG/USD towards the next relevant hurdle near the $23.75-$23.80 region (September 22 high) en route to the $24.00 round figure and the $24.30-$24.35 resistance zone.
Silver daily chart
Technical levels to watch