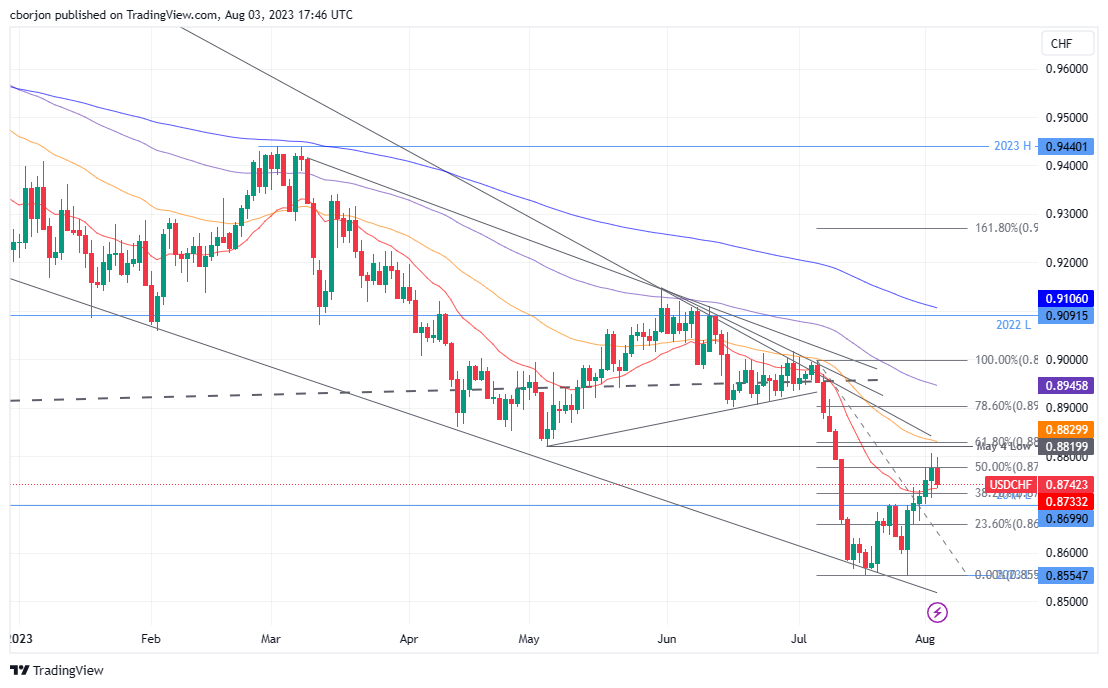
USD/CHF Price Analysis: Retreats despite high US bond yields, forms bearish-harami pattern
- USD/CHF retraces from four-week highs, trading at 0.8742, down 0.44% as USD dips even as Treasury bond yields remain elevated.
- Formation of a ‘bearish-harami’ two-candle chart pattern indicates potential further downside, with key support levels at 0.8733 (20-day EMA), 0.8724 (38.2% Fib), and 0.8700.
- If buyers prevail, resistance levels to watch are 0.8776 (50% Fib), 0.8805 (week’s high), and 0.8828 (61.8% Fib).
USD/CHF retraces as the US Dollar (USD) dips, despite US Treasury bond yields remaining high as market participants prepare for Friday’s US Nonfarm Payrolls report. Sentiment has shifted and is mixed, hence the greenback’s sudden weakness after hitting a new four-week high of 102.843, as shown by the US Dollar Index (DXY). At the time of writing, the USD/CHF is trading at 0.8742, down 0.44%.
USD/CHF Price Analysis: Technical outlook
From a daily chart perspective, the USD/CHF is forming a ‘bearish-harami’ two-candle chart pattern, which warrants further downside is expected, but support emerging at the 20-day Exponential Moving Average (EMA) at 0.8733, could hurt sellers’ plans for lower prices. If that scenario plays out, the USD/CHF next support to challenge would be the 38.2% Fibonacci (Fib) retracement at 0.8724, followed by the August 2 daily low of 0.8713, ahead of the 0.8700 figure.
On the other hand, if USD/CHF buyers move in, technical resistance emerges at the 50% Fib level at 0.8776, which, once cleared, will expose the current week’s high of 0.8805. A breach of the latter, the USD/CHF would rally toward the 61.8% Fib retracement at 08828.
USD/CHF Price Action – Daily chart

