GBP/USD Price Analysis: Bears prowl and eye a break below of 1.2050 again
- GBP/USD bears are in the market but bulls coming up for air.
- A break below 1.2050 again will likely seal the deal for the bears.
GBP/USD is meeting resistance near 1.2100 while traders assess the risks associated with the banking system crisis and weigh the prospects of a hawkish Federal Reserve and the Bank of England that both meet next week to decide on their interest rate paths.
From a technical perspective, a multi-timeframe analysis arrives at a bearish bias while GBP/USD remains pressured on the front side of the dominant bear trend.
GBP/USD monthly chart
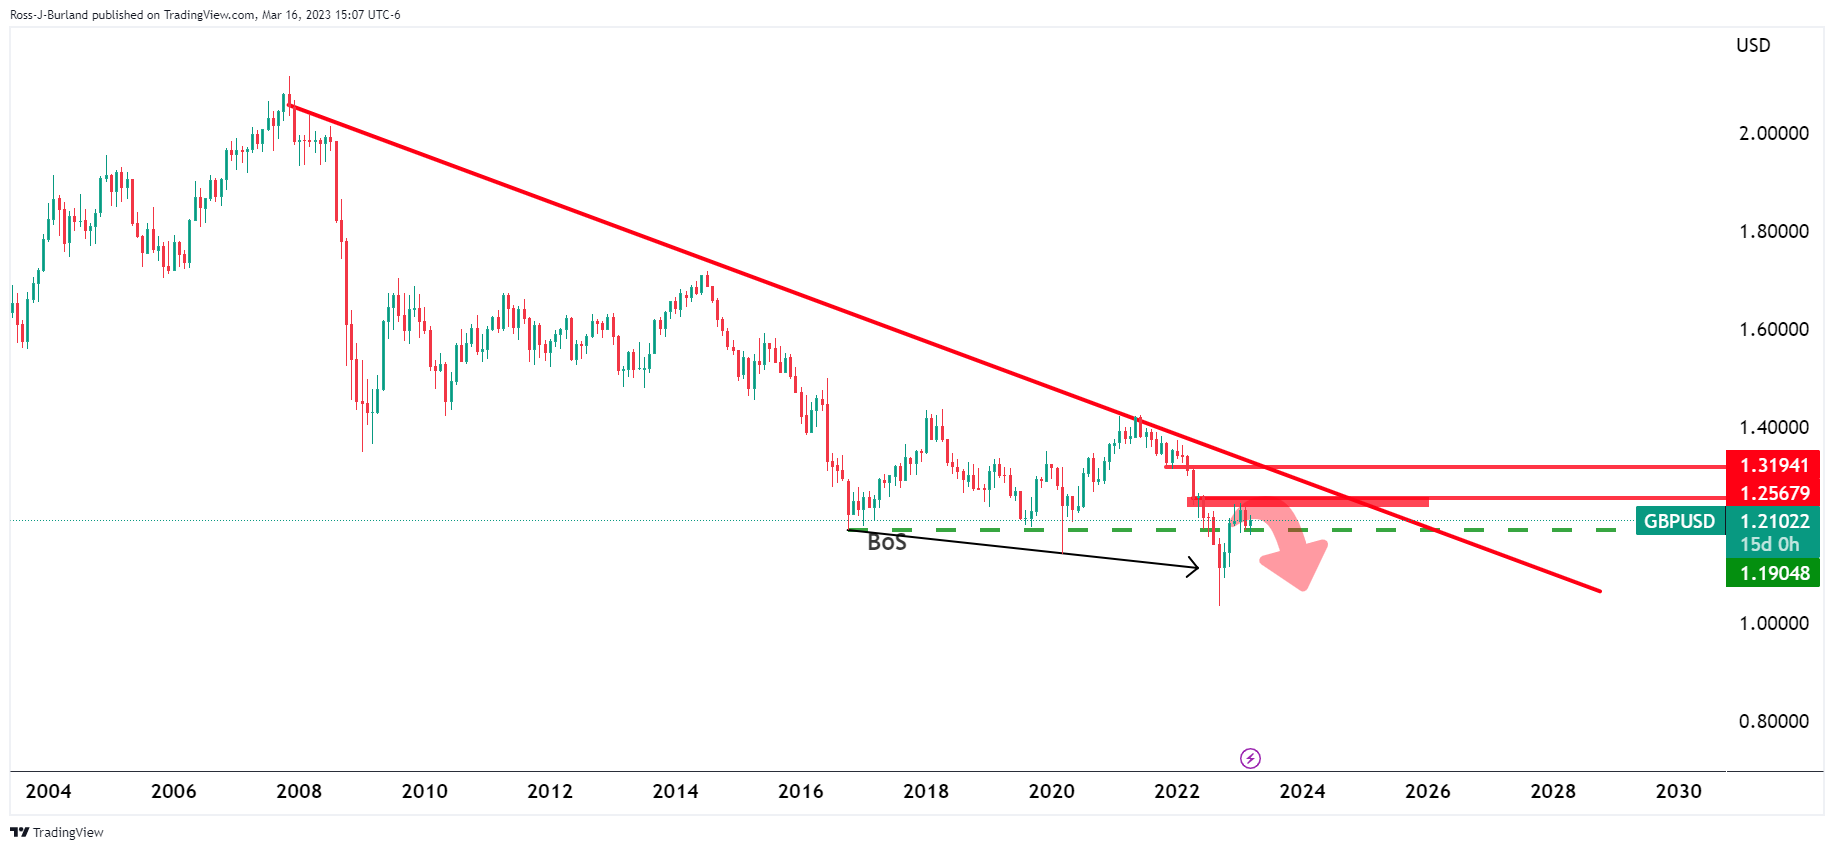
The break of structure, BoS, on the monthly chart is bearish for the immediate future as the bulls struggle to maintain form, on the correction back into the micro bear trend.
GBP/USD daily chart
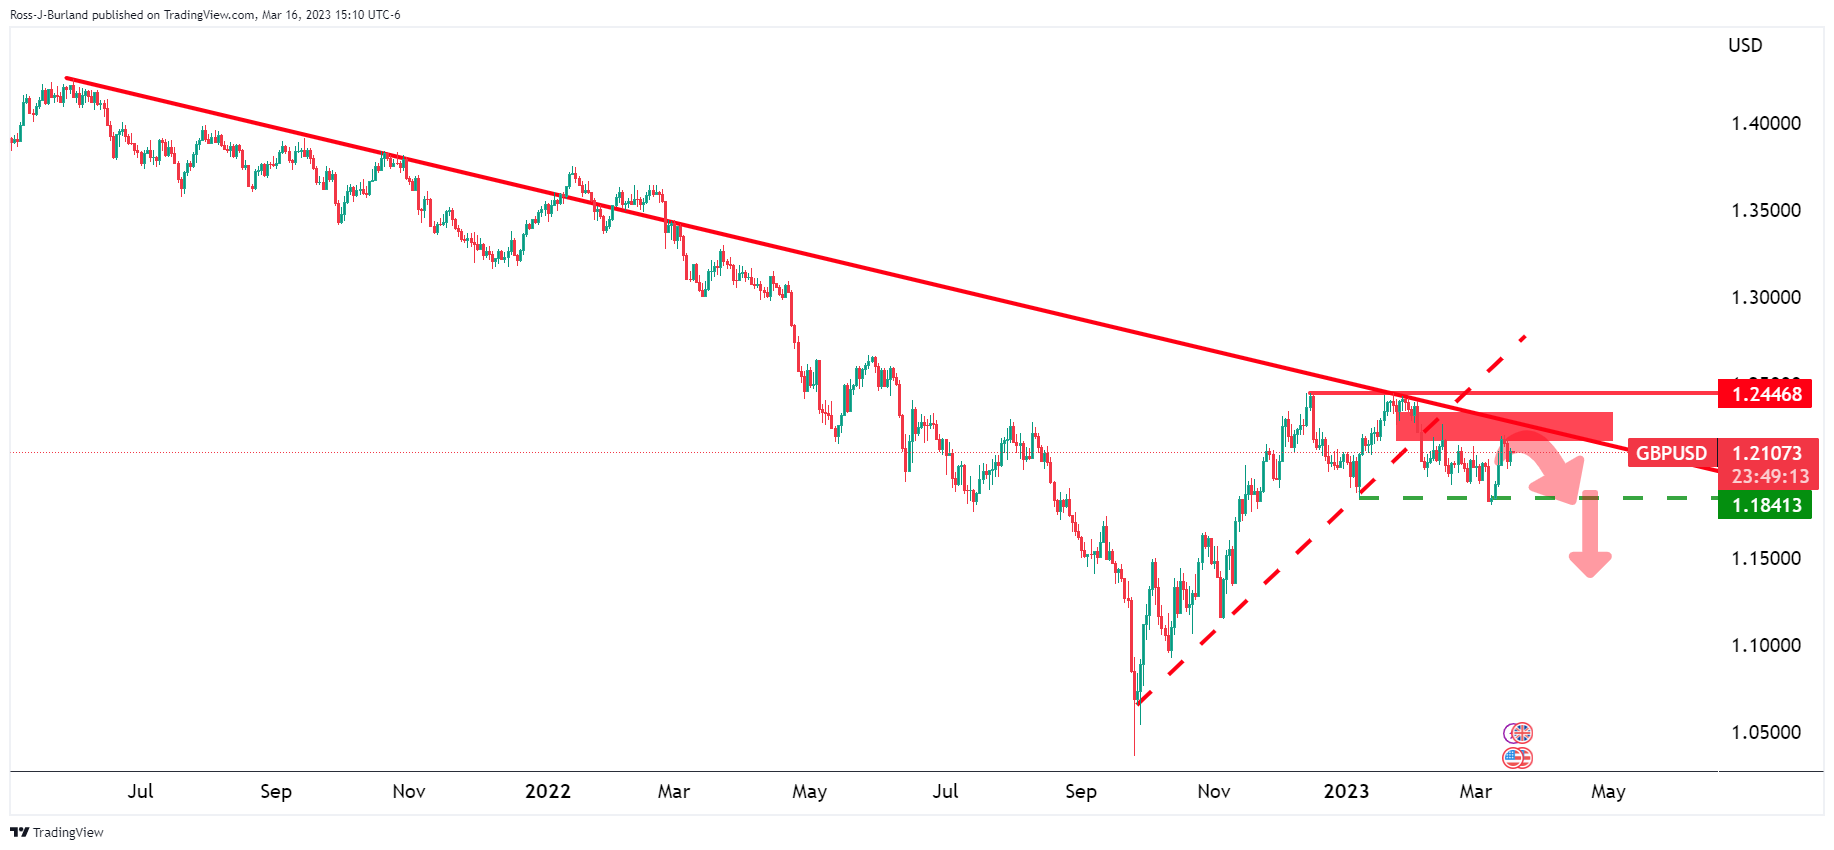
The daily chart sees the price trapped between structure and resistance, leaning with a bearish bias again.
GBP/USD H4 chart
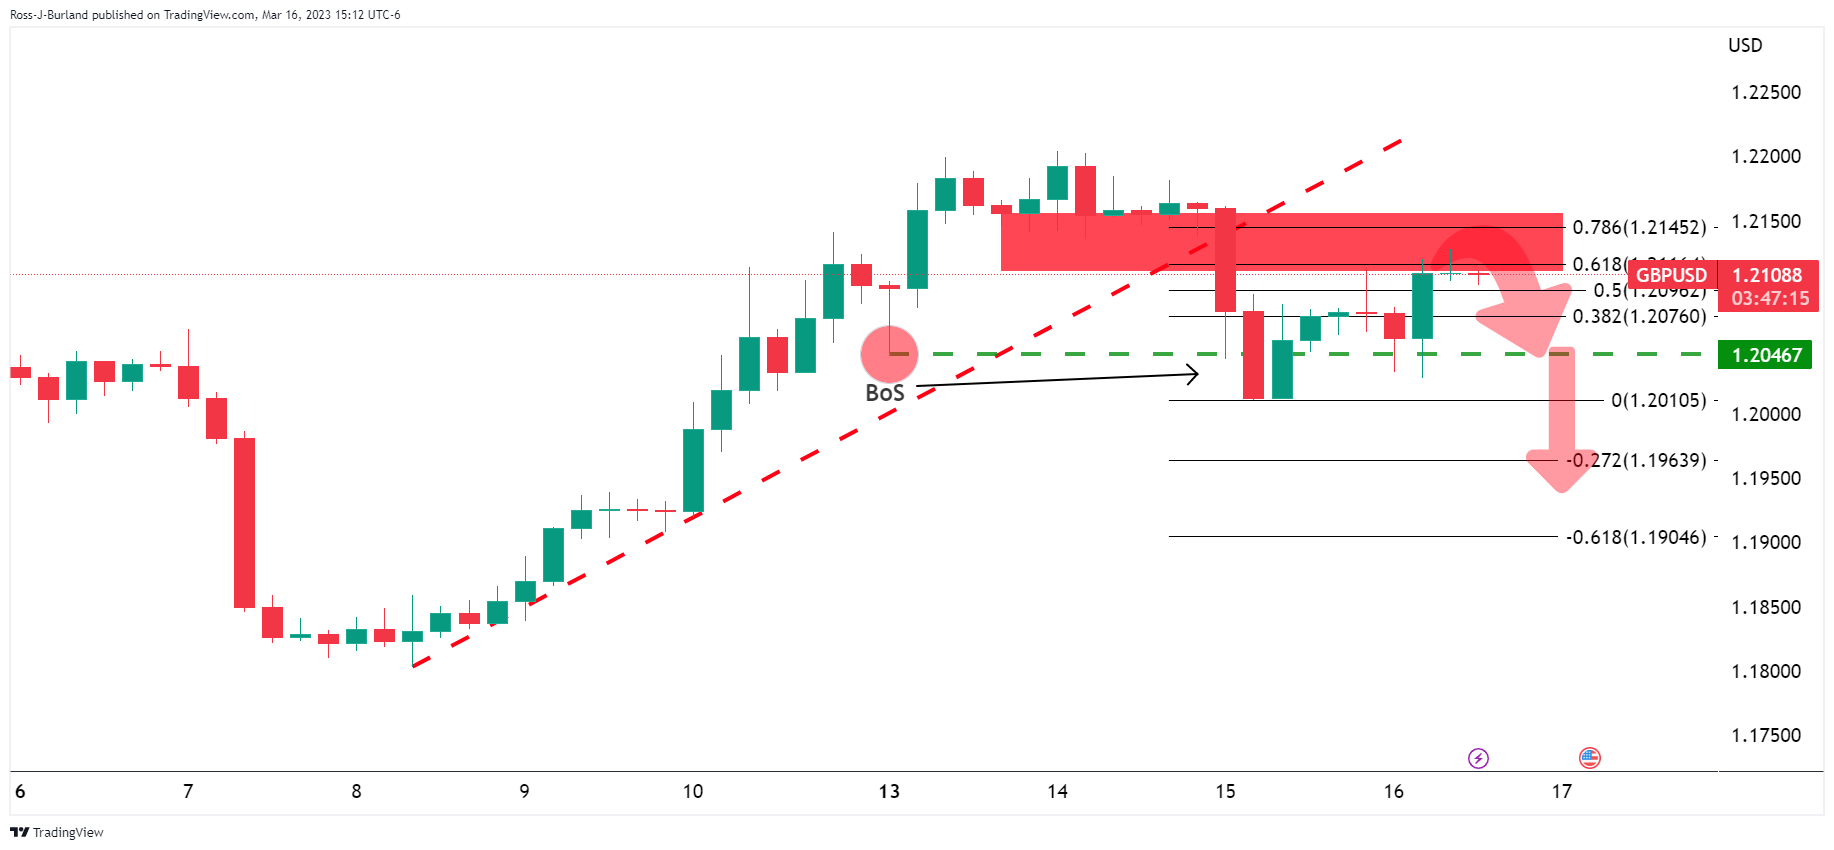
The bulls are testing the 1.21s but are on the backside of the prior bullish trend. There was a break of structure below 1.2050 which leaves the prospects also bearish for now.